
Tag: TrackMan

  • A Golfer’s Guide to Launch Monitor Metrics

    A Golfer’s Guide to Launch Monitor Metrics

    Ask most golfers what determines how far the ball goes and they’ll say the same thing: swing faster. And they’re not wrong — clubhead speed is the single biggest lever you can pull. But if clubhead speed were the whole story, every golfer who swings at 105 mph would carry the ball 280 yards. They don’t. The gap between swing speed and actual carry distance is where most amateur performance is lost, and it’s a gap that a launch monitor can make visible. This winter has been especially cold in Connecticut, so this is a perfect time to head to a place with a Trackman (like Golf Lab CT) before getting ready to face the especially long par 5s at Oxford Greens (like the 630-yard monster on hole #3)

    A 2023 paper published in the Strength and Conditioning Journal by Brennan and colleagues — researchers from Middlesex University, the DP World Tour Performance Institute, Columbia Business School, and the R&A — mapped out a deterministic model of the golf shot, tracing exactly how impact factors at the clubface cascade through to the launch characteristics of the ball and finally to the outcome measures of distance and accuracy. Their framework is the clearest summary of launch monitor science I’ve encountered, and it has practical implications for any golfer using TrackMan or a similar system.

    This article translates that research into actionable guidance: what to measure, what it means, and how to use it to add real carry yards without rebuilding your swing.

    The Outcome That Actually Matters: Strokes Gained

    Before diving into mechanics, it helps to understand what “better” means in quantitative terms. The metric that best captures driving performance is Strokes Gained Off the Tee (SGOTT), a framework developed by Mark Broadie — one of the paper’s co-authors — and now used by the PGA Tour for all tournament statistics.

    Strokes gained measures how many strokes a player gains or loses on a given shot relative to the field, based on where the shot started and where it finished. Broadie’s research found that the long game — tee shots and approach shots — accounts for approximately 72% of the variability in a PGA Tour player’s overall skill. Distance matters: an extra 20 yards off the tee is worth roughly 0.75 strokes per round. That’s a meaningful advantage over a full season.

    But strokes gained requires knowing shot location data typically only available during competition. For training purposes, the launch monitor metrics described below are the proxies that practitioners and golfers can actually work with — the upstream causes that feed into SGOTT.

    The Distance Chain: From Impact to Carry

    Brennan et al. describe shot distance as the product of a chain of causes. Understanding the chain tells you where to intervene. Here are the five variables that matter most.

    1. Ball Speed — The Master Metric

    Ball speed is the velocity of the ball’s center of gravity immediately after it separates from the clubface. It is the most direct predictor of carry distance: research shows that each 1 mph increase in ball speed produces approximately 1.83 yards of additional carry (Betzler et al., 2014). Ball speed is what you should optimize, not clubhead speed in isolation.

    Clubhead speed explains 75% of ball speed variance on its own, but that rises to 82% when impact location is also accounted for (Sweeney et al., 2013). The difference between those two numbers — that extra 7% — is the efficiency gap that most amateur golfers have available to them without changing their swing speed at all.

    2. Impact Location — The Efficiency Variable

    Impact location refers to where on the clubface the ball makes contact, measured in millimeters from the geometric center both vertically and horizontally. Striking off-center triggers the “gear effect” — the clubhead rotates around its center of gravity, altering spin characteristics and reducing ball speed.

    Off-center strikes to the toe produce right-to-left spin (draw spin for a right-hander). Off-center strikes to the heel produce left-to-right spin. Strikes high on the face reduce backspin; strikes low on the face increase it. All of these alter trajectory in ways that reduce carry distance even at identical swing speeds. This is why smash factor — the ratio of ball speed to clubhead speed — is the most actionable consistency metric on TrackMan. A smash factor of 1.50 is the theoretical maximum with driver; most recreational golfers average closer to 1.40–1.44. Closing that gap is free distance.

    3. Spin Rate — The Optimization Variable

    Backspin creates lift by acting perpendicular to the ball’s flight path, counteracting gravity and keeping the ball airborne longer. The problem is that excessive spin also increases drag and causes the ball to balloon, which reduces carry. Spin rate has an optimal range — it is not a case of more being better.

    Wallace et al. found that driver spin rates between 2,280 and 2,640 rpm maximize carry distance for elite players. Brennan et al. note that PGA Tour and LPGA Tour averages sit at approximately 2,685 and 2,682 rpm respectively — slightly above the theoretical optimum, suggesting that even tour players carry marginal spin inefficiency. For recreational players, spin rates of 3,200–3,800 rpm are common, which can represent a carry loss of 15–25 yards compared with an optimized spin profile at identical swing speeds. Spin rate is influenced by clubhead speed, vertical impact location, angle of attack, and dynamic loft — all of which are measurable.

    4. Launch Angle — The Trajectory Variable

    Launch angle is the vertical angle of the ball’s initial flight relative to the ground. Too low and the ball doesn’t stay airborne long enough to maximize carry. Too high and it balloons, generating excessive spin and losing distance. The research-supported optimal range for driver is 10–14 degrees for elite golfers, though some studies suggest up to 20 degrees can maximize carry distance under specific conditions.

    TrackMan University data provides a useful calibration point: a golfer swinging at 95 mph with a +4-degree attack angle (hitting up on the ball) should target a launch angle of 15.6 degrees and a spin rate of 2,404 rpm to maximize distance. The same 95 mph swing with a -4-degree attack angle (hitting down) should target 11.4 degrees launch and 3,150 rpm. Attack angle affects both launch angle and spin simultaneously, which is why sweeping the driver off the tee — with a slightly positive attack angle — tends to optimize both variables at once. Launch angle is strongly correlated with dynamic loft (r = 0.74).

    5. Dynamic Loft — The Loft You Actually Deliver

    Dynamic loft is the vertical orientation of the clubface at the moment of maximum compression — the effective loft delivered to the ball, which is often quite different from the club’s stated loft. Dynamic loft is the primary driver of launch angle (b = 0.58) and contributes meaningfully to spin rate. If dynamic loft is too high, backspin increases and distance suffers. If too low, the ball launches too flat.

    Increasing your attack angle with driver — hitting slightly up on the ball — reduces dynamic loft relative to the club’s physical loft, which is why it typically produces both lower spin and higher launch. The combination of positive attack angle and appropriately matched dynamic loft is the driver fitting formula that launch monitors were designed to optimize.

    Launch Monitor Reference: Key Distance Metrics

    This table summarizes the five core distance metrics, their optimal ranges for driver, and what to do if your numbers are outside those ranges.

    MetricOptimal Range (Driver)If Too LowIf Too High
    Ball Speed150–175+ mph (varies by CHS)Improve center contact; raise CHSN/A — maximize this metric
    Smash Factor1.48–1.50 with driverFocus on strike quality; find sweet spotTheoretical max is 1.50; maintain it
    Spin Rate2,280–2,640 rpm (elite)Check impact location & dynamic loftPositive attack angle; less dynamic loft
    Launch Angle10–14° (up to 20° in some models)Increase attack angle; raise dynamic loftReduce dynamic loft; check tee height
    Attack Angle+2° to +5° with driverTee ball slightly higher; widen stanceBall position adjustment; check setup

    Shot Dispersion: Why You Miss Offline

    Distance and accuracy are not independent variables — they share several upstream causes. Brennan et al. dedicate equal attention to shot dispersion, which is the lateral accuracy of the shot measured as how far offline the ball finishes relative to the intended target.

    Two launch characteristics govern dispersion: spin axis and launch direction. Both are primarily controlled by face angle at impact — the single most powerful accuracy variable in the golf swing.

    Spin Axis and the D-Plane

    The spin axis is the tilt angle of the ball’s rotational axis immediately after impact. When the spin axis is tilted, the ball curves. TrackMan reports that for every 5 degrees of spin axis tilt, the ball will deviate 3.5 yards per 100 yards of ball flight — meaning a 280-yard drive with a 10-degree spin axis tilt finishes approximately 20 yards offline.

    Face angle at impact explains 82% of spin axis variance (Miura, 2002). Club path influences spin axis as well but to a lesser degree. The relationship is described by the D-Plane theory: the ball’s initial direction is primarily determined by face angle, and the curve is determined by the relationship between face angle and club path. A face angle pointed right of path produces left-to-right spin (fade/slice); left of path produces right-to-left spin (draw/hook).

    Face Angle and Launch Direction

    Launch direction — the horizontal angle at which the ball departs the clubface — is explained by face angle up to 61–83% of the time (Wood et al., 2018). The practical implication is significant: Sweeney et al. found that a 2-degree error in launch direction with driver produces approximately 10 meters of offline distance at 280 meters of carry. The same 2-degree error with a 120-meter wedge produces only 4 meters of offline deviation.

    This explains why driver accuracy is so disproportionately affected by small face angle errors compared with shorter clubs. The amplification of face angle errors with driver is one reason why many golfers should prioritize face control work before obsessing over swing path.

    A Practical TrackMan Monitoring Protocol

    Brennan et al. emphasize that monitoring variability in these metrics — not just peak values — is essential for practitioners and golfers using launch monitors. They recommend establishing baseline scores for key metrics, then using the coefficient of variation (CV) to set targets for meaningful improvement. Here is how to apply that framework in a practical TrackMan session.

    Session Structure by Week

    WeekTrackMan Session FocusShots
    1Baseline only. 20 drivers at normal intent. Record mean and SD for ball speed, smash factor, spin rate, launch angle. No swing changes.20
    2Identify primary fault. If smash factor < 1.44: impact location work. If spin > 3,000 rpm: attack angle and tee height drills. If launch < 10°: dynamic loft assessment.20
    3Targeted intervention. Use feedback from Week 2 to address single variable. Hit 15 balls per session tracking only the target metric.15
    4Validation session. Repeat Week 1 protocol exactly. Compare mean and SD across all metrics against baseline. Look for co-improvement in related metrics.20
    5–6Integration. Hit shots without deliberate mechanical focus. Allow adaptations to consolidate. Monitor carry distance and dispersion as outcome measures.20–25

    Key Metrics to Track — What Improvement Looks Like

    • Ball Speed SD: Target variability of ±5 mph or less across a 20-ball session. Wild swings indicate inconsistent strike or tempo.
    • Smash Factor: Each 0.01 improvement in average smash factor is worth approximately 1.5 mph of ball speed without changing swing speed. Target 1.47+ as an intermediate golfer.
    • Spin Rate: For most recreational players, reducing spin from 3,200 to 2,700 rpm (through attack angle and tee height adjustment) can add 12–18 yards of carry at identical swing speeds.
    • Launch Angle: Should be within 1–2 degrees of your optimal value across a session. Large variance in launch angle indicates inconsistent dynamic loft delivery.
    • Carry Distance SD: This is the final proof. Brennan et al. suggest using the CV to set targets — a CV of 5% on driving distance means your carry must improve by more than 5% before the change exceeds measurement noise.

    A Note on Skill Level and Metric Usability

    Brennan et al. make an important practical point that often gets overlooked: the usability of some metrics depends on a golfer’s skill level. A professional golfer can produce reasonably consistent clubhead speed and distance on demand. A 18-handicapper may show consistent clubhead speed but far more variable carry distance — because the ability to transfer speed consistently into ball speed requires a level of strike quality that develops over time.

    This means that recreational golfers should probably focus first on smash factor and spin rate consistency before chasing raw ball speed gains. A 95 mph swing hitting 1.47 smash factor will outcarry a 100 mph swing hitting 1.39 smash factor every time. Get the efficiency right first; the speed gains will layer on top.

    Final Word

    TrackMan and comparable launch monitors are now available at most Connecticut simulators and indoor facilities, typically included in the hourly bay rate. The information they provide is only useful if you know what to look for. Brennan et al.’s deterministic model gives you the map: ball speed drives carry distance, and ball speed is determined by clubhead speed multiplied by strike efficiency. Spin rate needs to be optimized, not maximized. Launch angle needs to match your attack angle and dynamic loft. Face angle governs dispersion.

    None of this requires a swing overhaul. Impact location, attack angle, and tee height are all adjustable without mechanical reconstruction. A single focused TrackMan session — baseline numbers, identify the primary fault, set a target — is more likely to improve your driving distance than another bucket of balls hit without feedback.

    Clubhead speed matters. But as Brennan and colleagues make clear, it’s only the beginning of the chain. The golfers who close the gap between potential distance and actual distance are the ones who understand the links between impact and carry — and work on them methodically.

    Source: Brennan A, Ehlert A, Wells J, Broadie M, Coughlan D, Turner A, Bishop C. Monitoring Performance in Golf: More Than Just Clubhead Speed. Strength and Conditioning Journal. 45(6):631–641, December 2023.

  • A Data-Driven Guide to Driver Shot Dispersion

    A Data-Driven Guide to Driver Shot Dispersion

    Swing speed gets the headlines. Distance gets the marketing. But for most recreational golfers, shot dispersion is the number that actually determines their score. You can hit a 280-yard drive into the trees on every par 4 at Fairchild Wheeler and walk off the course with a 95. You can hit a 240-yard drive down the center of the fairway every time and break 80. The scorecard doesn’t care how far you hit it. It cares where it ends up. The problem is that most golfers have no systematic understanding of why the ball misses offline. They think it’s the swing path. They try to fix the swing path. The ball keeps curving. What they’re actually missing is the face angle — the variable that research consistently identifies as the dominant driver of both starting direction and shot curve.

    Brennan et al. (2023), in their comprehensive review of launch monitor metrics published in the Strength and Conditioning Journal, lay out exactly how dispersion is created at the impact interval and what you can measure on TrackMan to diagnose and fix it. This article translates that framework into a practical six-week protocol for tightening your dispersion pattern. This is something that I’ve personally struggled quite a bit — over the winter, I’ve been grinding at Golf Lab CT to make sure that I can score better when spring comes. I hope this helps you as well!

    What Shot Dispersion Actually Measures

    Dispersion is the lateral accuracy of a golf shot: how far offline the ball finishes relative to your intended target. For a right-handed golfer, a ball finishing left of target is a pull, and a ball finishing right is a push. Dispersion encompasses both the starting direction of the shot and any subsequent curve during flight.

    What is dispersion?

    The PGA Tour tracks driving accuracy as the percentage of fairways hit, but Brennan et al. flag a critical limitation of that statistic: it treats a drive that misses the fairway by one foot the same as a drive that flies out of bounds. A better measure of dispersion is the average lateral distance offline across a session — which TrackMan can calculate automatically.

    Broadie’s strokes gained research established that a blend of distance and accuracy off the tee produces the lowest scores. But accuracy is not about hitting every fairway — it’s about eliminating the catastrophic miss. A 20-yard draw that finishes in the left rough is survivable. A 40-yard slice into the trees costs you a stroke. Dispersion training is fundamentally about reducing the tail end of your miss pattern, not perfecting the average.

    The D-Plane: Why the Ball Goes Where It Goes

    The foundational concept behind shot dispersion is the D-Plane theory, developed by physicist Ted Jorgensen and later expanded by TrackMan’s research team. Understanding this model is the single biggest conceptual upgrade most golfers can make, because it contradicts what most people believe about the relationship between swing path and ball flight.

    The D-Plane describes the relationship between two vectors at impact: the direction the clubhead is moving (club path) and the orientation of the clubface (face angle). These two vectors form a tilted plane, and the ball’s flight lies on that plane. The key insight is this: the ball starts primarily in the direction the face is pointing, not in the direction the club is swinging. Then it curves away from the path, toward or away from the face angle, depending on their relationship.

    For a right-handed golfer: when the face points right of the path at impact, the ball starts right and curves further right (fade or slice). When the face points left of the path, the ball starts left and curves further left (draw or hook). The path influences the degree of curve; the face governs the starting direction. This is why fixing your swing path without addressing face angle rarely stops the ball from curving — you’ve addressed the secondary variable while leaving the primary one untouched.

    More drills to tighten up dispersion / D-plane variance

    The Four Variables That Govern Dispersion

    1. Face Angle — The Master Variable

    Face angle is the horizontal orientation of the clubface at the moment of maximum compression — whether the face is open (pointing right of target for a right-hander), square, or closed (pointing left). Research reviewed by Brennan et al. establishes that face angle alone explains 82% of spin axis variance (Miura, 2002) and 61–83% of launch direction variance (Wood et al., 2018).

    To put the real-world impact in concrete terms: Sweeney et al. found that a 2-degree face angle error with driver produces approximately 10 meters (33 feet) of lateral dispersion at 280 meters of carry. The same 2-degree error with a 120-meter wedge produces only 4 meters offline. The amplification effect is proportional to distance — which is why driver accuracy is so punishing compared to iron accuracy, even for identical swing errors.

    TrackMan reports face angle in degrees relative to the target line. A face angle of +2.0 is open (pointing 2 degrees right). A face angle of -2.0 is closed (pointing 2 degrees left). For a square shot, you want face angle at or near 0. Most recreational golfers show face angle variability of ±4–6 degrees across a session without realizing it.

    2. Spin Axis — The Curve Variable

    Spin axis is the tilt of the ball’s rotational axis immediately after impact. When the spin axis is tilted, the Magnus effect causes the ball to curve in the direction of the tilt. A neutral spin axis (0 degrees) produces straight flight. A positive tilt (axis tilted right) produces a draw for a right-hander. A negative tilt (axis tilted left) produces a fade.

    TrackMan reports a specific quantitative rule that makes the spin axis immediately actionable: for every 5 degrees of spin axis tilt, the ball deviates 3.5 yards per 100 yards of ball flight. A 280-yard drive with a spin axis of 10 degrees will finish approximately 20 yards offline. A 280-yard drive with a spin axis of 20 degrees will finish approximately 40 yards offline.

    Spin axis is primarily controlled by the relationship between face angle and club path. Specifically, the spin axis tilt equals roughly the difference between face angle and club path. A path of 2 degrees in-to-out with a face angle of 0 degrees produces a spin axis tilted approximately 2 degrees — a gentle draw. A path of 6 degrees out-to-in with a face angle of 2 degrees open produces a spin axis tilted approximately 4 degrees left — a fade. The math isn’t perfect, but the directional relationship is consistent.

    3. Club Path — The Secondary Variable

    Club path is the horizontal direction the clubhead is traveling at maximum compression, measured in degrees relative to the target line. An in-to-out path (positive number) swings from inside the target line to outside. An out-to-in path (negative number) swings from outside to inside, which is the classic “over the top” move associated with slices.

    The research reviewed by Brennan et al. establishes that club path has a meaningful influence on spin axis but does not directly determine launch direction to a significant degree — that is primarily the face’s job. However, path and face angle interact to determine the degree of spin axis tilt: the larger the difference between face angle and path, the more the spin axis tilts, and the more the ball curves. A path of +5 degrees with a face angle of +4 degrees produces very little curve (1 degree difference). A path of +5 degrees with a face angle of -1 degree produces significant left-to-right curve (6 degree difference).

    4. Launch Direction — The Starting Line

    Launch direction is the horizontal angle at which the ball initially departs the clubface, measured in degrees relative to the target line. It is distinct from spin axis: launch direction tells you where the ball starts; spin axis tells you how it curves from there.

    Wood et al.’s study of 731 driver shots, 745 seven-iron shots, and 99 wedge shots found that face angle accounts for 61–83% of launch direction. Club path accounts for the remaining variance. The practical implication is that if your ball is starting offline before it even begins to curve, the face is pointing offline at impact. No amount of path correction will fix a face angle problem.

    TrackMan Dispersion Reference: What the Numbers Mean

    This table translates each dispersion metric into actionable benchmarks and corrective directions.

    MetricTarget (Driver)If Offline to the RightIf Offline to the Left
    Face Angle0° ±1.5°Face open at impact — strengthen grip or rotate lead wrist to closed at topFace closed at impact — weaken grip or check forearm rotation through impact
    Club Path-2° to +2° for straight playOut-to-in path (negative) — work on drop into slot; shallow the downswingIn-to-out path (positive) — check target line; ensure correct alignment
    Spin Axis±5° for controlled flightPositive tilt (left-to-right curve) — face pointing right of path at impactNegative tilt (right-to-left curve) — face pointing left of path at impact
    Launch Direction±2° of target lineFace open at address or impact — check alignment and face square at setupFace closed or aimed left at address — check alignment and grip pressure
    Face-to-Path Differential< 3° for low curve shotsFace more open than path — fade/slice producing; close face or change pathFace more closed than path — draw/hook producing; open face or adjust path

    The 6-Week Dispersion Protocol on TrackMan

    Brennan et al. emphasize that monitoring variability — not just peak values — is the key discipline for practitioners working with launch monitor data. This protocol applies that principle to dispersion training: establish a baseline, identify the primary cause, address it in isolation, then validate the improvement with data.

    Each session runs 20–30 minutes. Three to four sessions per week is the recommended cadence. Do not attempt to fix path and face simultaneously — address the dominant fault first.

    WeekSession FocusShots
    1Baseline only. 20 drivers at normal intent. Record face angle, club path, spin axis, launch direction, and lateral dispersion for every shot. Make no swing changes.20
    2Diagnosis. Review baseline data. Calculate your average face angle and average face-to-path differential. If face-to-path > 4 degrees, face control is the primary fault. If face angle is consistent but spin axis is high, path is secondary. Target the larger number.20
    3Face angle intervention. Hit 20 drivers with a single focus: face angle at impact. Use gate drill (alignment sticks inside and outside the ball) or toe-up at parallel checkpoint to build face awareness. Watch only face angle on TrackMan.20
    4Face-to-path integration. Once face angle SD is under 2 degrees, add club path awareness. Hit 10 balls focusing on path, then 10 combining both. Track face-to-path differential as your primary metric.20
    5Shot shaping and intentional dispersion. Hit 5 intentional fades and 5 intentional draws using face-to-path manipulation. Verify on TrackMan that spin axis responds as expected. This confirms you can control the variable.15
    6Validation session. Repeat Week 1 protocol exactly. Compare mean and SD for all dispersion metrics against baseline. Measure average lateral dispersion in yards as your headline outcome metric.20

    Key Metrics to Track — What Improvement Looks Like

    • Face Angle SD: Your session-to-session standard deviation should drop below 2 degrees. Pre-training, recreational golfers typically show ±3–6 degrees of variance without realizing it. This single improvement accounts for the majority of dispersion gains.
    • Face-to-Path Differential: The difference between your face angle and club path on each shot. A differential under 3 degrees produces low-curve ball flight. Over 6 degrees produces the kind of dramatic curve that finds trees. Target the differential before targeting path in isolation.
    • Spin Axis SD: Should tighten to ±5 degrees or less across a 20-ball session. Each 5-degree reduction in average spin axis tilt saves approximately 3.5 yards of lateral deviation per 100 yards of ball flight.
    • Average Lateral Dispersion (yards offline): The headline outcome metric. Measure your baseline, then compare at Week 4 and Week 6. A reduction from 35 to 22 yards offline — the kind of improvement achievable in this window — is the difference between hitting one fairway out of four and three out of four.
    • Launch Direction: Should cluster within ±2 degrees of your target line. If launch direction is consistent but spin axis is high, path and face are offsetting each other partially — a useful diagnostic finding.

    Common Dispersion Mistakes and How to Fix Them

    Mistake 1: Fixing path when the face is the problem

    The most common training error in golf. If your ball starts right and curves right, most golfers assume they’re swinging out-to-in and work endlessly on swing path. But if the face is open at impact, the ball will always start and curve right regardless of path adjustments. Check your face angle average on TrackMan before touching your path. If face angle is outside ±2 degrees, that’s your primary fault.

    Mistake 2: Chasing zero dispersion

    Every golfer, including tour professionals, has a natural shot shape driven by their body mechanics and grip. Attempting to hit perfectly straight shots creates tension and inconsistency. A better target is a consistent, predictable shape with a known dispersion window. Brennan et al. note that even intentional side spin is a valid outcome if it can be reliably reproduced. Know your shape; manage it; eliminate the opposite miss.

    Mistake 3: Practicing dispersion with partial swings

    Chipping and half-swing drills don’t train face control at driver impact speeds. The face angle errors that matter occur at 100+ mph clubhead speed, and the neuromuscular patterns at half speed are different from those at full speed. Dispersion training must be done at full intent, with real shots on TrackMan, to generate meaningful feedback.

    Mistake 4: Ignoring alignment as a variable

    Launch direction includes alignment error — if you consistently aim 3 degrees right of target, every shot will appear to start 3 degrees offline even with a square face. Before diagnosing face angle from TrackMan data, verify your alignment with an alignment stick pointed at the target. Eliminate the setup variable before analyzing the swing variable.

    Dispersion and Skill Level: What the Research Says

    Brennan et al. flag an important nuance: the relationship between launch metrics and ball flight outcomes depends on skill level. Higher-handicap golfers tend to show greater variability in all dispersion metrics, which makes it harder to isolate a single cause. However, Betzler et al.’s research within the same review found that as handicap decreases, golfers exhibit not just more clubhead speed but improved efficiency and consistency across all impact factors.

    The practical implication is that recreational golfers should expect more noise in their TrackMan data and should use more shots (20–25 per session minimum) to establish reliable averages. The standard deviation metrics matter as much as the mean values: a face angle that averages 1 degree open but has a standard deviation of 5 degrees is a more serious problem than a face angle that averages 3 degrees open with a standard deviation of 1.5 degrees. The former is unpredictable; the latter is a consistent, manageable bias.

    Final Word

    The TrackMan data that most golfers ignore is right there in the report: face angle, club path, spin axis, launch direction. These numbers explain every offline shot you’ve ever hit. Brennan et al.’s research makes the causal chain explicit — face angle governs where the ball starts, the face-to-path differential governs how much it curves, and the product of both is your dispersion pattern. Fix the face first. Then address the path. Then measure the result with actual carry data.

    A 40-yard average dispersion offline means half your drives travel more than 40 yards from your target line. A 22-yard average means the rough at worst, the fairway often. That is a three-stroke swing over a round, without changing your swing speed, your equipment, or your fundamental mechanics. Just the face angle, measured, corrected, and validated on a launch monitor.

    The fairway is a narrow target. But it becomes considerably less narrow when you understand, with data, exactly why you’re missing it.

    Source: Brennan A, Ehlert A, Wells J, Broadie M, Coughlan D, Turner A, Bishop C. Monitoring Performance in Golf: More Than Just Clubhead Speed. Strength and Conditioning Journal. 45(6):631–641, December 2023.

  • How to Use the Tour Tempo App to Optimize Your Driver

    How to Use the Tour Tempo App to Optimize Your Driver

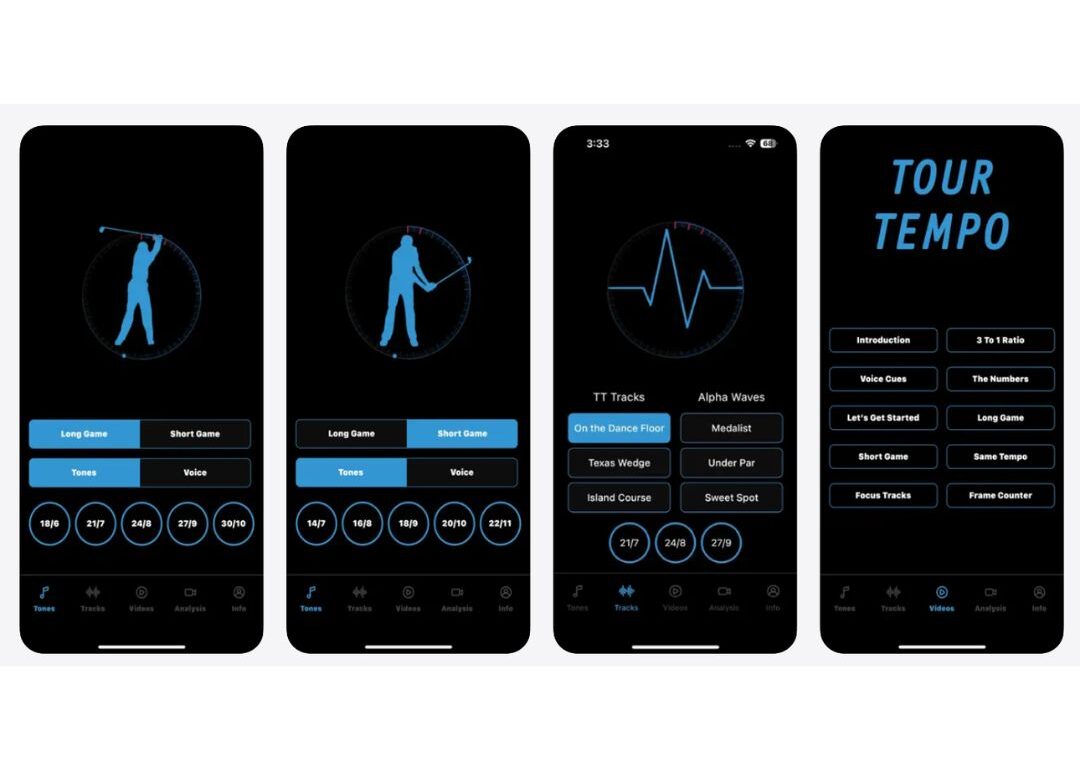
    I spent two years chasing distance before I realized my real problem was consistency. My TrackMan numbers told the story: swing speed varied by 8 mph shot to shot, launch angle fluctuated wildly, and my dispersion pattern looked like a shotgun blast. The issue wasn’t my swing mechanics—it was that I had no swing mechanics. Every rep was a different tempo, a different rhythm, a different timing sequence. The Tour Tempo app helped to improve that. I first heard about this app from the Wicked Smart Golf podcast, and have really liked it after buying it. Based on research by John Novosel analyzing thousands of tour player swings, the app trains you to match proven tempo ratios—specifically the 3:1 ratio used by most tour pros with driver. Three frames from takeaway to top of backswing, one frame from top to impact. The app uses audio tones to mark these positions, giving you an external metronome to lock in repeatable timing.

    After six weeks of training with Tour Tempo while tracking progress on TrackMan, my driver dispersion dropped from an average of 42 yards offline to 25 yards. Swing speed consistency tightened from ±8 mph to ±2 mph. Smash factor climbed from 1.42 to 1.48. Most importantly, my misses became predictable. This is the protocol I built and how to implement it yourself.

    Understanding Tour Tempo Ratios

    Tour Tempo is built on frame-count analysis of professional swings filmed at 30 frames per second. The research found that tour players cluster around specific timing ratios regardless of their overall swing speed. For driver, the dominant ratio is 3:1—meaning the backswing takes three times as long as the downswing. In absolute time, this typically translates to 27 frames total: 21 frames from start to top, 6 frames from top to impact. At 30 fps, that’s 0.70 seconds backswing, 0.20 seconds downswing, 0.90 seconds total. The app offers multiple tempo options—24/8 (faster, more aggressive), 27/9 (tour standard), and 30/10 (slower, more controlled). Each maintains the 3:1 ratio. There’s also a 2:1 ratio option (18/9) used by some players with irons, but for driver work, I recommend starting with 27/9. It matches the statistical mode of tour swings and provides enough backswing time to load properly without rushing the transition.

    The great thing of the system is that it doesn’t care about your swing mechanics. You can swing flat or upright, one-plane or two-plane, strong grip or weak grip—the tempo ratio works regardless. What it fixes is the timing variable that most amateurs never address. We spend hours on swing path and face angle and ignore the fact that our swing takes a different amount of time every single rep.

    The 6-Week Tour Tempo and TrackMan Protocol

    This protocol layers tempo training into your existing practice while using TrackMan to validate improvements in consistency. Weeks 1-2 focus on ingraining the audio tones without a ball. Weeks 3-4 introduce ball striking with tempo focus. Weeks 5-6 integrate tempo into full TrackMan sessions and dial in your optimal frame count. Each session takes 20-30 minutes. Four sessions per week is ideal, but three will work.

    The key is separating tempo acquisition from ball striking initially. If you try to match the tones while worrying about contact quality, you’ll subconsciously adjust your tempo to “save” bad swings. Build the timing pattern first in a zero-pressure environment, then layer in the ball.

    Tour Tempo Training Protocol by Week

    WeekTraining FocusReps
    1No ball. Practice swings only with 27/9 tones. Focus on hearing all three beeps (start, top, impact). Use alignment stick or club.30-40
    2Continue no-ball work. Add ‘eyes closed’ drill for 10 reps. Establish baseline TrackMan session (20 drivers, no tempo focus).30-40
    3Introduce ball. 5 tempo-only swings (no ball), then 10 balls with tones. Accept mishits. Track on TrackMan.15
    4Full TrackMan session with tones. 20 drivers. Compare dispersion and consistency metrics to Week 2 baseline.20
    5Test alternate tempos: try 24/8 (faster) and 30/10 (slower). Hit 8 balls each. Compare TrackMan metrics.24
    6Lock in optimal tempo. Full 25-ball TrackMan session with your best-performing tempo. Wean off tones for final 5 swings.25

    How to Use the Audio Tones During Practice

    The Tour Tempo app plays three tones per swing. Tone 1 marks your takeaway start. Tone 2 marks top of backswing. Tone 3 marks impact. For the 27/9 setting, you’ll hear a rhythm that sounds roughly like: beep… beep… BEEP. The first two tones are spaced further apart (the backswing), the final tone comes quickly after the second (the downswing). Start each rep by pressing play, then beginning your swing on the first tone. Don’t try to match the tones consciously—just let them play and swing naturally while listening. After 10-15 reps, your nervous system will start syncing to the rhythm automatically. You’ll feel yourself ‘waiting’ for the second tone at the top and releasing on cue when the third tone fires.

    The most common mistake is trying to force the match. If you consciously slow down or speed up to hit the tones, you’ll create mechanical compensation patterns. Instead, swing freely and notice where your natural timing falls relative to the tones. Early in Week 1, you might be consistently late to the top (hitting your actual top position after tone 2) or rushing the downswing (impacting before tone 3). That’s fine. The feedback loop is what trains the adjustment.

    TrackMan Metrics to Track for Tempo Optimization

    Tempo training isn’t about hitting it farther—it’s about hitting it the same. The TrackMan metrics that matter most are consistency and predictability, not peak performance. Here’s what to monitor:

    • Swing Speed Standard Deviation: Your goal is ±2 mph or less across a 20-ball session. Pre-tempo, mine was ±8 mph. Post-tempo: ±1.8 mph.
    • Lateral Dispersion (offline distance): Measure how far left or right your shots finish from centerline. Pre-tempo average: 42 yards. Post-tempo: 25 yards.
    • Launch Angle Consistency: Should stay within ±2 degrees. Wild variance indicates inconsistent delivery. Mine tightened from ±4.5° to ±1.8°.
    • Smash Factor: This will improve as strike quality becomes more consistent. Target 1.48+ with driver. Mine improved from 1.42 to 1.48 average.
    • Spin Rate Variance: Should cluster within ±300 RPM. Tempo fixes delivery path, which stabilizes dynamic loft and attack angle.

    In Week 2, establish your baseline by hitting 20 drivers without the app—just your natural swing. Record all five metrics. Then in Week 4 and Week 6, repeat the 20-ball session with tempo tones active and compare. The improvement in standard deviation and dispersion is where tempo makes its case.

    Supporting Video Resources

    Master the 3:1 Ratio: Gain Speed and Consistency with Tour Tempo

    Stop overthinking your mechanics and start swinging with the rhythm of a tour pro!

    The Simple Secret to Carrying Your Driver 300+ Yards

    Learn how to optimize your impact to maximize every ounce of power in your swing

    Common Tempo Mistakes and How to Fix Them

    Mistake 1: Starting the app mid-swing

    The tones only work if you start moving on tone 1. If you press play and then wait to swing, you’ll be chasing the rhythm instead of syncing to it. Press play, hear tone 1, start your takeaway. The timing should feel like: tone = move, not move = tone.

    Mistake 2: Forcing mechanical changes to match the tones

    Don’t artificially slow your backswing or rush your downswing. Swing naturally and let the mismatch reveal itself. Your body will adjust over reps. If you consciously manipulate tempo, you’ll build compensation patterns that fall apart under pressure.

    Mistake 3: Jumping straight to ball striking

    Week 1 exists for a reason. If you skip the no-ball reps, you’ll be managing two learning curves simultaneously—tempo matching and strike quality. Separate them. Build the tempo pattern in a zero-consequence environment first.

    Mistake 4: Sticking with one tempo without testing alternatives

    The 27/9 setting is the statistical mode, but it’s not universal. Some players naturally swing faster or slower. Week 5 is designed to test this. Hit balls with 24/8 and 30/10 and see which produces better TrackMan consistency. The right tempo is the one where your metrics tighten, not the one that “feels” right.

    Final Word

    The Tour Tempo app costs $24.99. A single TrackMan session at most facilities in Connecticut runs $40-60 (or free if you have a membership at Golf Lab CT). Total investment for this protocol: under $300 if you’re paying for range time and TrackMan access. The ROI isn’t measured in yards gained—it’s measured in fairways hit, greens in regulation, and strokes saved from eliminating the catastrophic miss.

    Tempo is the invisible variable in the golf swing. You can’t see it on video. It doesn’t show up in a mirror. But it governs everything—transition timing, sequencing, strike quality, consistency. The Tour Tempo app makes the invisible visible by giving you an external reference point. The TrackMan validates that the timing improvements are transferring to ball flight.

    I’ve used this protocol twice now—once in the fall and once during an off-season reset. Both times, the dispersion numbers improved by 35-40%. Both times, the consistency metrics tightened significantly. And both times, the gains carried into actual rounds. If you’ve ever felt like your swing is different every day, like you don’t know which version of yourself is showing up on the first tee, tempo training is the answer. It won’t make you longer. But it will make you the same. And in golf, being the same is often better than being great.