Category: Training Reviews

  • A Golfer’s Guide to Launch Monitor Metrics

    A Golfer’s Guide to Launch Monitor Metrics

    Ask most golfers what determines how far the ball goes and they’ll say the same thing: swing faster. And they’re not wrong — clubhead speed is the single biggest lever you can pull. But if clubhead speed were the whole story, every golfer who swings at 105 mph would carry the ball 280 yards. They don’t. The gap between swing speed and actual carry distance is where most amateur performance is lost, and it’s a gap that a launch monitor can make visible. This winter has been especially cold in Connecticut, so this is a perfect time to head to a place with a Trackman (like Golf Lab CT) before getting ready to face the especially long par 5s at Oxford Greens (like the 630-yard monster on hole #3)

    A 2023 paper published in the Strength and Conditioning Journal by Brennan and colleagues — researchers from Middlesex University, the DP World Tour Performance Institute, Columbia Business School, and the R&A — mapped out a deterministic model of the golf shot, tracing exactly how impact factors at the clubface cascade through to the launch characteristics of the ball and finally to the outcome measures of distance and accuracy. Their framework is the clearest summary of launch monitor science I’ve encountered, and it has practical implications for any golfer using TrackMan or a similar system.

    This article translates that research into actionable guidance: what to measure, what it means, and how to use it to add real carry yards without rebuilding your swing.

    The Outcome That Actually Matters: Strokes Gained

    Before diving into mechanics, it helps to understand what “better” means in quantitative terms. The metric that best captures driving performance is Strokes Gained Off the Tee (SGOTT), a framework developed by Mark Broadie — one of the paper’s co-authors — and now used by the PGA Tour for all tournament statistics.

    Strokes gained measures how many strokes a player gains or loses on a given shot relative to the field, based on where the shot started and where it finished. Broadie’s research found that the long game — tee shots and approach shots — accounts for approximately 72% of the variability in a PGA Tour player’s overall skill. Distance matters: an extra 20 yards off the tee is worth roughly 0.75 strokes per round. That’s a meaningful advantage over a full season.

    But strokes gained requires knowing shot location data typically only available during competition. For training purposes, the launch monitor metrics described below are the proxies that practitioners and golfers can actually work with — the upstream causes that feed into SGOTT.

    The Distance Chain: From Impact to Carry

    Brennan et al. describe shot distance as the product of a chain of causes. Understanding the chain tells you where to intervene. Here are the five variables that matter most.

    1. Ball Speed — The Master Metric

    Ball speed is the velocity of the ball’s center of gravity immediately after it separates from the clubface. It is the most direct predictor of carry distance: research shows that each 1 mph increase in ball speed produces approximately 1.83 yards of additional carry (Betzler et al., 2014). Ball speed is what you should optimize, not clubhead speed in isolation.

    Clubhead speed explains 75% of ball speed variance on its own, but that rises to 82% when impact location is also accounted for (Sweeney et al., 2013). The difference between those two numbers — that extra 7% — is the efficiency gap that most amateur golfers have available to them without changing their swing speed at all.

    2. Impact Location — The Efficiency Variable

    Impact location refers to where on the clubface the ball makes contact, measured in millimeters from the geometric center both vertically and horizontally. Striking off-center triggers the “gear effect” — the clubhead rotates around its center of gravity, altering spin characteristics and reducing ball speed.

    Off-center strikes to the toe produce right-to-left spin (draw spin for a right-hander). Off-center strikes to the heel produce left-to-right spin. Strikes high on the face reduce backspin; strikes low on the face increase it. All of these alter trajectory in ways that reduce carry distance even at identical swing speeds. This is why smash factor — the ratio of ball speed to clubhead speed — is the most actionable consistency metric on TrackMan. A smash factor of 1.50 is the theoretical maximum with driver; most recreational golfers average closer to 1.40–1.44. Closing that gap is free distance.

    3. Spin Rate — The Optimization Variable

    Backspin creates lift by acting perpendicular to the ball’s flight path, counteracting gravity and keeping the ball airborne longer. The problem is that excessive spin also increases drag and causes the ball to balloon, which reduces carry. Spin rate has an optimal range — it is not a case of more being better.

    Wallace et al. found that driver spin rates between 2,280 and 2,640 rpm maximize carry distance for elite players. Brennan et al. note that PGA Tour and LPGA Tour averages sit at approximately 2,685 and 2,682 rpm respectively — slightly above the theoretical optimum, suggesting that even tour players carry marginal spin inefficiency. For recreational players, spin rates of 3,200–3,800 rpm are common, which can represent a carry loss of 15–25 yards compared with an optimized spin profile at identical swing speeds. Spin rate is influenced by clubhead speed, vertical impact location, angle of attack, and dynamic loft — all of which are measurable.

    4. Launch Angle — The Trajectory Variable

    Launch angle is the vertical angle of the ball’s initial flight relative to the ground. Too low and the ball doesn’t stay airborne long enough to maximize carry. Too high and it balloons, generating excessive spin and losing distance. The research-supported optimal range for driver is 10–14 degrees for elite golfers, though some studies suggest up to 20 degrees can maximize carry distance under specific conditions.

    TrackMan University data provides a useful calibration point: a golfer swinging at 95 mph with a +4-degree attack angle (hitting up on the ball) should target a launch angle of 15.6 degrees and a spin rate of 2,404 rpm to maximize distance. The same 95 mph swing with a -4-degree attack angle (hitting down) should target 11.4 degrees launch and 3,150 rpm. Attack angle affects both launch angle and spin simultaneously, which is why sweeping the driver off the tee — with a slightly positive attack angle — tends to optimize both variables at once. Launch angle is strongly correlated with dynamic loft (r = 0.74).

    5. Dynamic Loft — The Loft You Actually Deliver

    Dynamic loft is the vertical orientation of the clubface at the moment of maximum compression — the effective loft delivered to the ball, which is often quite different from the club’s stated loft. Dynamic loft is the primary driver of launch angle (b = 0.58) and contributes meaningfully to spin rate. If dynamic loft is too high, backspin increases and distance suffers. If too low, the ball launches too flat.

    Increasing your attack angle with driver — hitting slightly up on the ball — reduces dynamic loft relative to the club’s physical loft, which is why it typically produces both lower spin and higher launch. The combination of positive attack angle and appropriately matched dynamic loft is the driver fitting formula that launch monitors were designed to optimize.

    Launch Monitor Reference: Key Distance Metrics

    This table summarizes the five core distance metrics, their optimal ranges for driver, and what to do if your numbers are outside those ranges.

    MetricOptimal Range (Driver)If Too LowIf Too High
    Ball Speed150–175+ mph (varies by CHS)Improve center contact; raise CHSN/A — maximize this metric
    Smash Factor1.48–1.50 with driverFocus on strike quality; find sweet spotTheoretical max is 1.50; maintain it
    Spin Rate2,280–2,640 rpm (elite)Check impact location & dynamic loftPositive attack angle; less dynamic loft
    Launch Angle10–14° (up to 20° in some models)Increase attack angle; raise dynamic loftReduce dynamic loft; check tee height
    Attack Angle+2° to +5° with driverTee ball slightly higher; widen stanceBall position adjustment; check setup

    Shot Dispersion: Why You Miss Offline

    Distance and accuracy are not independent variables — they share several upstream causes. Brennan et al. dedicate equal attention to shot dispersion, which is the lateral accuracy of the shot measured as how far offline the ball finishes relative to the intended target.

    Two launch characteristics govern dispersion: spin axis and launch direction. Both are primarily controlled by face angle at impact — the single most powerful accuracy variable in the golf swing.

    Spin Axis and the D-Plane

    The spin axis is the tilt angle of the ball’s rotational axis immediately after impact. When the spin axis is tilted, the ball curves. TrackMan reports that for every 5 degrees of spin axis tilt, the ball will deviate 3.5 yards per 100 yards of ball flight — meaning a 280-yard drive with a 10-degree spin axis tilt finishes approximately 20 yards offline.

    Face angle at impact explains 82% of spin axis variance (Miura, 2002). Club path influences spin axis as well but to a lesser degree. The relationship is described by the D-Plane theory: the ball’s initial direction is primarily determined by face angle, and the curve is determined by the relationship between face angle and club path. A face angle pointed right of path produces left-to-right spin (fade/slice); left of path produces right-to-left spin (draw/hook).

    Face Angle and Launch Direction

    Launch direction — the horizontal angle at which the ball departs the clubface — is explained by face angle up to 61–83% of the time (Wood et al., 2018). The practical implication is significant: Sweeney et al. found that a 2-degree error in launch direction with driver produces approximately 10 meters of offline distance at 280 meters of carry. The same 2-degree error with a 120-meter wedge produces only 4 meters of offline deviation.

    This explains why driver accuracy is so disproportionately affected by small face angle errors compared with shorter clubs. The amplification of face angle errors with driver is one reason why many golfers should prioritize face control work before obsessing over swing path.

    A Practical TrackMan Monitoring Protocol

    Brennan et al. emphasize that monitoring variability in these metrics — not just peak values — is essential for practitioners and golfers using launch monitors. They recommend establishing baseline scores for key metrics, then using the coefficient of variation (CV) to set targets for meaningful improvement. Here is how to apply that framework in a practical TrackMan session.

    Session Structure by Week

    WeekTrackMan Session FocusShots
    1Baseline only. 20 drivers at normal intent. Record mean and SD for ball speed, smash factor, spin rate, launch angle. No swing changes.20
    2Identify primary fault. If smash factor < 1.44: impact location work. If spin > 3,000 rpm: attack angle and tee height drills. If launch < 10°: dynamic loft assessment.20
    3Targeted intervention. Use feedback from Week 2 to address single variable. Hit 15 balls per session tracking only the target metric.15
    4Validation session. Repeat Week 1 protocol exactly. Compare mean and SD across all metrics against baseline. Look for co-improvement in related metrics.20
    5–6Integration. Hit shots without deliberate mechanical focus. Allow adaptations to consolidate. Monitor carry distance and dispersion as outcome measures.20–25

    Key Metrics to Track — What Improvement Looks Like

    • Ball Speed SD: Target variability of ±5 mph or less across a 20-ball session. Wild swings indicate inconsistent strike or tempo.
    • Smash Factor: Each 0.01 improvement in average smash factor is worth approximately 1.5 mph of ball speed without changing swing speed. Target 1.47+ as an intermediate golfer.
    • Spin Rate: For most recreational players, reducing spin from 3,200 to 2,700 rpm (through attack angle and tee height adjustment) can add 12–18 yards of carry at identical swing speeds.
    • Launch Angle: Should be within 1–2 degrees of your optimal value across a session. Large variance in launch angle indicates inconsistent dynamic loft delivery.
    • Carry Distance SD: This is the final proof. Brennan et al. suggest using the CV to set targets — a CV of 5% on driving distance means your carry must improve by more than 5% before the change exceeds measurement noise.

    A Note on Skill Level and Metric Usability

    Brennan et al. make an important practical point that often gets overlooked: the usability of some metrics depends on a golfer’s skill level. A professional golfer can produce reasonably consistent clubhead speed and distance on demand. A 18-handicapper may show consistent clubhead speed but far more variable carry distance — because the ability to transfer speed consistently into ball speed requires a level of strike quality that develops over time.

    This means that recreational golfers should probably focus first on smash factor and spin rate consistency before chasing raw ball speed gains. A 95 mph swing hitting 1.47 smash factor will outcarry a 100 mph swing hitting 1.39 smash factor every time. Get the efficiency right first; the speed gains will layer on top.

    Final Word

    TrackMan and comparable launch monitors are now available at most Connecticut simulators and indoor facilities, typically included in the hourly bay rate. The information they provide is only useful if you know what to look for. Brennan et al.’s deterministic model gives you the map: ball speed drives carry distance, and ball speed is determined by clubhead speed multiplied by strike efficiency. Spin rate needs to be optimized, not maximized. Launch angle needs to match your attack angle and dynamic loft. Face angle governs dispersion.

    None of this requires a swing overhaul. Impact location, attack angle, and tee height are all adjustable without mechanical reconstruction. A single focused TrackMan session — baseline numbers, identify the primary fault, set a target — is more likely to improve your driving distance than another bucket of balls hit without feedback.

    Clubhead speed matters. But as Brennan and colleagues make clear, it’s only the beginning of the chain. The golfers who close the gap between potential distance and actual distance are the ones who understand the links between impact and carry — and work on them methodically.

    Source: Brennan A, Ehlert A, Wells J, Broadie M, Coughlan D, Turner A, Bishop C. Monitoring Performance in Golf: More Than Just Clubhead Speed. Strength and Conditioning Journal. 45(6):631–641, December 2023.

  • A Data-Driven Guide to Driver Shot Dispersion

    A Data-Driven Guide to Driver Shot Dispersion

    Swing speed gets the headlines. Distance gets the marketing. But for most recreational golfers, shot dispersion is the number that actually determines their score. You can hit a 280-yard drive into the trees on every par 4 at Fairchild Wheeler and walk off the course with a 95. You can hit a 240-yard drive down the center of the fairway every time and break 80. The scorecard doesn’t care how far you hit it. It cares where it ends up. The problem is that most golfers have no systematic understanding of why the ball misses offline. They think it’s the swing path. They try to fix the swing path. The ball keeps curving. What they’re actually missing is the face angle — the variable that research consistently identifies as the dominant driver of both starting direction and shot curve.

    Brennan et al. (2023), in their comprehensive review of launch monitor metrics published in the Strength and Conditioning Journal, lay out exactly how dispersion is created at the impact interval and what you can measure on TrackMan to diagnose and fix it. This article translates that framework into a practical six-week protocol for tightening your dispersion pattern. This is something that I’ve personally struggled quite a bit — over the winter, I’ve been grinding at Golf Lab CT to make sure that I can score better when spring comes. I hope this helps you as well!

    What Shot Dispersion Actually Measures

    Dispersion is the lateral accuracy of a golf shot: how far offline the ball finishes relative to your intended target. For a right-handed golfer, a ball finishing left of target is a pull, and a ball finishing right is a push. Dispersion encompasses both the starting direction of the shot and any subsequent curve during flight.

    What is dispersion?

    The PGA Tour tracks driving accuracy as the percentage of fairways hit, but Brennan et al. flag a critical limitation of that statistic: it treats a drive that misses the fairway by one foot the same as a drive that flies out of bounds. A better measure of dispersion is the average lateral distance offline across a session — which TrackMan can calculate automatically.

    Broadie’s strokes gained research established that a blend of distance and accuracy off the tee produces the lowest scores. But accuracy is not about hitting every fairway — it’s about eliminating the catastrophic miss. A 20-yard draw that finishes in the left rough is survivable. A 40-yard slice into the trees costs you a stroke. Dispersion training is fundamentally about reducing the tail end of your miss pattern, not perfecting the average.

    The D-Plane: Why the Ball Goes Where It Goes

    The foundational concept behind shot dispersion is the D-Plane theory, developed by physicist Ted Jorgensen and later expanded by TrackMan’s research team. Understanding this model is the single biggest conceptual upgrade most golfers can make, because it contradicts what most people believe about the relationship between swing path and ball flight.

    The D-Plane describes the relationship between two vectors at impact: the direction the clubhead is moving (club path) and the orientation of the clubface (face angle). These two vectors form a tilted plane, and the ball’s flight lies on that plane. The key insight is this: the ball starts primarily in the direction the face is pointing, not in the direction the club is swinging. Then it curves away from the path, toward or away from the face angle, depending on their relationship.

    For a right-handed golfer: when the face points right of the path at impact, the ball starts right and curves further right (fade or slice). When the face points left of the path, the ball starts left and curves further left (draw or hook). The path influences the degree of curve; the face governs the starting direction. This is why fixing your swing path without addressing face angle rarely stops the ball from curving — you’ve addressed the secondary variable while leaving the primary one untouched.

    More drills to tighten up dispersion / D-plane variance

    The Four Variables That Govern Dispersion

    1. Face Angle — The Master Variable

    Face angle is the horizontal orientation of the clubface at the moment of maximum compression — whether the face is open (pointing right of target for a right-hander), square, or closed (pointing left). Research reviewed by Brennan et al. establishes that face angle alone explains 82% of spin axis variance (Miura, 2002) and 61–83% of launch direction variance (Wood et al., 2018).

    To put the real-world impact in concrete terms: Sweeney et al. found that a 2-degree face angle error with driver produces approximately 10 meters (33 feet) of lateral dispersion at 280 meters of carry. The same 2-degree error with a 120-meter wedge produces only 4 meters offline. The amplification effect is proportional to distance — which is why driver accuracy is so punishing compared to iron accuracy, even for identical swing errors.

    TrackMan reports face angle in degrees relative to the target line. A face angle of +2.0 is open (pointing 2 degrees right). A face angle of -2.0 is closed (pointing 2 degrees left). For a square shot, you want face angle at or near 0. Most recreational golfers show face angle variability of ±4–6 degrees across a session without realizing it.

    2. Spin Axis — The Curve Variable

    Spin axis is the tilt of the ball’s rotational axis immediately after impact. When the spin axis is tilted, the Magnus effect causes the ball to curve in the direction of the tilt. A neutral spin axis (0 degrees) produces straight flight. A positive tilt (axis tilted right) produces a draw for a right-hander. A negative tilt (axis tilted left) produces a fade.

    TrackMan reports a specific quantitative rule that makes the spin axis immediately actionable: for every 5 degrees of spin axis tilt, the ball deviates 3.5 yards per 100 yards of ball flight. A 280-yard drive with a spin axis of 10 degrees will finish approximately 20 yards offline. A 280-yard drive with a spin axis of 20 degrees will finish approximately 40 yards offline.

    Spin axis is primarily controlled by the relationship between face angle and club path. Specifically, the spin axis tilt equals roughly the difference between face angle and club path. A path of 2 degrees in-to-out with a face angle of 0 degrees produces a spin axis tilted approximately 2 degrees — a gentle draw. A path of 6 degrees out-to-in with a face angle of 2 degrees open produces a spin axis tilted approximately 4 degrees left — a fade. The math isn’t perfect, but the directional relationship is consistent.

    3. Club Path — The Secondary Variable

    Club path is the horizontal direction the clubhead is traveling at maximum compression, measured in degrees relative to the target line. An in-to-out path (positive number) swings from inside the target line to outside. An out-to-in path (negative number) swings from outside to inside, which is the classic “over the top” move associated with slices.

    The research reviewed by Brennan et al. establishes that club path has a meaningful influence on spin axis but does not directly determine launch direction to a significant degree — that is primarily the face’s job. However, path and face angle interact to determine the degree of spin axis tilt: the larger the difference between face angle and path, the more the spin axis tilts, and the more the ball curves. A path of +5 degrees with a face angle of +4 degrees produces very little curve (1 degree difference). A path of +5 degrees with a face angle of -1 degree produces significant left-to-right curve (6 degree difference).

    4. Launch Direction — The Starting Line

    Launch direction is the horizontal angle at which the ball initially departs the clubface, measured in degrees relative to the target line. It is distinct from spin axis: launch direction tells you where the ball starts; spin axis tells you how it curves from there.

    Wood et al.’s study of 731 driver shots, 745 seven-iron shots, and 99 wedge shots found that face angle accounts for 61–83% of launch direction. Club path accounts for the remaining variance. The practical implication is that if your ball is starting offline before it even begins to curve, the face is pointing offline at impact. No amount of path correction will fix a face angle problem.

    TrackMan Dispersion Reference: What the Numbers Mean

    This table translates each dispersion metric into actionable benchmarks and corrective directions.

    MetricTarget (Driver)If Offline to the RightIf Offline to the Left
    Face Angle0° ±1.5°Face open at impact — strengthen grip or rotate lead wrist to closed at topFace closed at impact — weaken grip or check forearm rotation through impact
    Club Path-2° to +2° for straight playOut-to-in path (negative) — work on drop into slot; shallow the downswingIn-to-out path (positive) — check target line; ensure correct alignment
    Spin Axis±5° for controlled flightPositive tilt (left-to-right curve) — face pointing right of path at impactNegative tilt (right-to-left curve) — face pointing left of path at impact
    Launch Direction±2° of target lineFace open at address or impact — check alignment and face square at setupFace closed or aimed left at address — check alignment and grip pressure
    Face-to-Path Differential< 3° for low curve shotsFace more open than path — fade/slice producing; close face or change pathFace more closed than path — draw/hook producing; open face or adjust path

    The 6-Week Dispersion Protocol on TrackMan

    Brennan et al. emphasize that monitoring variability — not just peak values — is the key discipline for practitioners working with launch monitor data. This protocol applies that principle to dispersion training: establish a baseline, identify the primary cause, address it in isolation, then validate the improvement with data.

    Each session runs 20–30 minutes. Three to four sessions per week is the recommended cadence. Do not attempt to fix path and face simultaneously — address the dominant fault first.

    WeekSession FocusShots
    1Baseline only. 20 drivers at normal intent. Record face angle, club path, spin axis, launch direction, and lateral dispersion for every shot. Make no swing changes.20
    2Diagnosis. Review baseline data. Calculate your average face angle and average face-to-path differential. If face-to-path > 4 degrees, face control is the primary fault. If face angle is consistent but spin axis is high, path is secondary. Target the larger number.20
    3Face angle intervention. Hit 20 drivers with a single focus: face angle at impact. Use gate drill (alignment sticks inside and outside the ball) or toe-up at parallel checkpoint to build face awareness. Watch only face angle on TrackMan.20
    4Face-to-path integration. Once face angle SD is under 2 degrees, add club path awareness. Hit 10 balls focusing on path, then 10 combining both. Track face-to-path differential as your primary metric.20
    5Shot shaping and intentional dispersion. Hit 5 intentional fades and 5 intentional draws using face-to-path manipulation. Verify on TrackMan that spin axis responds as expected. This confirms you can control the variable.15
    6Validation session. Repeat Week 1 protocol exactly. Compare mean and SD for all dispersion metrics against baseline. Measure average lateral dispersion in yards as your headline outcome metric.20

    Key Metrics to Track — What Improvement Looks Like

    • Face Angle SD: Your session-to-session standard deviation should drop below 2 degrees. Pre-training, recreational golfers typically show ±3–6 degrees of variance without realizing it. This single improvement accounts for the majority of dispersion gains.
    • Face-to-Path Differential: The difference between your face angle and club path on each shot. A differential under 3 degrees produces low-curve ball flight. Over 6 degrees produces the kind of dramatic curve that finds trees. Target the differential before targeting path in isolation.
    • Spin Axis SD: Should tighten to ±5 degrees or less across a 20-ball session. Each 5-degree reduction in average spin axis tilt saves approximately 3.5 yards of lateral deviation per 100 yards of ball flight.
    • Average Lateral Dispersion (yards offline): The headline outcome metric. Measure your baseline, then compare at Week 4 and Week 6. A reduction from 35 to 22 yards offline — the kind of improvement achievable in this window — is the difference between hitting one fairway out of four and three out of four.
    • Launch Direction: Should cluster within ±2 degrees of your target line. If launch direction is consistent but spin axis is high, path and face are offsetting each other partially — a useful diagnostic finding.

    Common Dispersion Mistakes and How to Fix Them

    Mistake 1: Fixing path when the face is the problem

    The most common training error in golf. If your ball starts right and curves right, most golfers assume they’re swinging out-to-in and work endlessly on swing path. But if the face is open at impact, the ball will always start and curve right regardless of path adjustments. Check your face angle average on TrackMan before touching your path. If face angle is outside ±2 degrees, that’s your primary fault.

    Mistake 2: Chasing zero dispersion

    Every golfer, including tour professionals, has a natural shot shape driven by their body mechanics and grip. Attempting to hit perfectly straight shots creates tension and inconsistency. A better target is a consistent, predictable shape with a known dispersion window. Brennan et al. note that even intentional side spin is a valid outcome if it can be reliably reproduced. Know your shape; manage it; eliminate the opposite miss.

    Mistake 3: Practicing dispersion with partial swings

    Chipping and half-swing drills don’t train face control at driver impact speeds. The face angle errors that matter occur at 100+ mph clubhead speed, and the neuromuscular patterns at half speed are different from those at full speed. Dispersion training must be done at full intent, with real shots on TrackMan, to generate meaningful feedback.

    Mistake 4: Ignoring alignment as a variable

    Launch direction includes alignment error — if you consistently aim 3 degrees right of target, every shot will appear to start 3 degrees offline even with a square face. Before diagnosing face angle from TrackMan data, verify your alignment with an alignment stick pointed at the target. Eliminate the setup variable before analyzing the swing variable.

    Dispersion and Skill Level: What the Research Says

    Brennan et al. flag an important nuance: the relationship between launch metrics and ball flight outcomes depends on skill level. Higher-handicap golfers tend to show greater variability in all dispersion metrics, which makes it harder to isolate a single cause. However, Betzler et al.’s research within the same review found that as handicap decreases, golfers exhibit not just more clubhead speed but improved efficiency and consistency across all impact factors.

    The practical implication is that recreational golfers should expect more noise in their TrackMan data and should use more shots (20–25 per session minimum) to establish reliable averages. The standard deviation metrics matter as much as the mean values: a face angle that averages 1 degree open but has a standard deviation of 5 degrees is a more serious problem than a face angle that averages 3 degrees open with a standard deviation of 1.5 degrees. The former is unpredictable; the latter is a consistent, manageable bias.

    Final Word

    The TrackMan data that most golfers ignore is right there in the report: face angle, club path, spin axis, launch direction. These numbers explain every offline shot you’ve ever hit. Brennan et al.’s research makes the causal chain explicit — face angle governs where the ball starts, the face-to-path differential governs how much it curves, and the product of both is your dispersion pattern. Fix the face first. Then address the path. Then measure the result with actual carry data.

    A 40-yard average dispersion offline means half your drives travel more than 40 yards from your target line. A 22-yard average means the rough at worst, the fairway often. That is a three-stroke swing over a round, without changing your swing speed, your equipment, or your fundamental mechanics. Just the face angle, measured, corrected, and validated on a launch monitor.

    The fairway is a narrow target. But it becomes considerably less narrow when you understand, with data, exactly why you’re missing it.

    Source: Brennan A, Ehlert A, Wells J, Broadie M, Coughlan D, Turner A, Bishop C. Monitoring Performance in Golf: More Than Just Clubhead Speed. Strength and Conditioning Journal. 45(6):631–641, December 2023.

  • How to Use the Tour Tempo App to Optimize Your Driver

    How to Use the Tour Tempo App to Optimize Your Driver

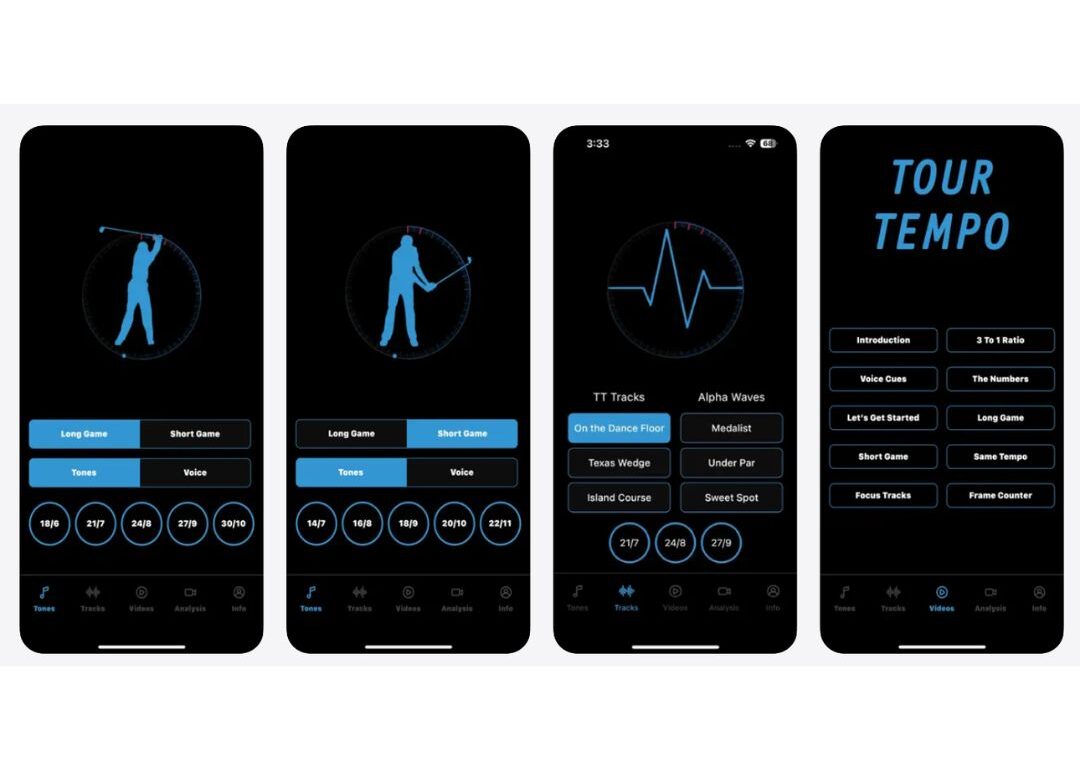
    I spent two years chasing distance before I realized my real problem was consistency. My TrackMan numbers told the story: swing speed varied by 8 mph shot to shot, launch angle fluctuated wildly, and my dispersion pattern looked like a shotgun blast. The issue wasn’t my swing mechanics—it was that I had no swing mechanics. Every rep was a different tempo, a different rhythm, a different timing sequence. The Tour Tempo app helped to improve that. I first heard about this app from the Wicked Smart Golf podcast, and have really liked it after buying it. Based on research by John Novosel analyzing thousands of tour player swings, the app trains you to match proven tempo ratios—specifically the 3:1 ratio used by most tour pros with driver. Three frames from takeaway to top of backswing, one frame from top to impact. The app uses audio tones to mark these positions, giving you an external metronome to lock in repeatable timing.

    After six weeks of training with Tour Tempo while tracking progress on TrackMan, my driver dispersion dropped from an average of 42 yards offline to 25 yards. Swing speed consistency tightened from ±8 mph to ±2 mph. Smash factor climbed from 1.42 to 1.48. Most importantly, my misses became predictable. This is the protocol I built and how to implement it yourself.

    Understanding Tour Tempo Ratios

    Tour Tempo is built on frame-count analysis of professional swings filmed at 30 frames per second. The research found that tour players cluster around specific timing ratios regardless of their overall swing speed. For driver, the dominant ratio is 3:1—meaning the backswing takes three times as long as the downswing. In absolute time, this typically translates to 27 frames total: 21 frames from start to top, 6 frames from top to impact. At 30 fps, that’s 0.70 seconds backswing, 0.20 seconds downswing, 0.90 seconds total. The app offers multiple tempo options—24/8 (faster, more aggressive), 27/9 (tour standard), and 30/10 (slower, more controlled). Each maintains the 3:1 ratio. There’s also a 2:1 ratio option (18/9) used by some players with irons, but for driver work, I recommend starting with 27/9. It matches the statistical mode of tour swings and provides enough backswing time to load properly without rushing the transition.

    The great thing of the system is that it doesn’t care about your swing mechanics. You can swing flat or upright, one-plane or two-plane, strong grip or weak grip—the tempo ratio works regardless. What it fixes is the timing variable that most amateurs never address. We spend hours on swing path and face angle and ignore the fact that our swing takes a different amount of time every single rep.

    The 6-Week Tour Tempo and TrackMan Protocol

    This protocol layers tempo training into your existing practice while using TrackMan to validate improvements in consistency. Weeks 1-2 focus on ingraining the audio tones without a ball. Weeks 3-4 introduce ball striking with tempo focus. Weeks 5-6 integrate tempo into full TrackMan sessions and dial in your optimal frame count. Each session takes 20-30 minutes. Four sessions per week is ideal, but three will work.

    The key is separating tempo acquisition from ball striking initially. If you try to match the tones while worrying about contact quality, you’ll subconsciously adjust your tempo to “save” bad swings. Build the timing pattern first in a zero-pressure environment, then layer in the ball.

    Tour Tempo Training Protocol by Week

    WeekTraining FocusReps
    1No ball. Practice swings only with 27/9 tones. Focus on hearing all three beeps (start, top, impact). Use alignment stick or club.30-40
    2Continue no-ball work. Add ‘eyes closed’ drill for 10 reps. Establish baseline TrackMan session (20 drivers, no tempo focus).30-40
    3Introduce ball. 5 tempo-only swings (no ball), then 10 balls with tones. Accept mishits. Track on TrackMan.15
    4Full TrackMan session with tones. 20 drivers. Compare dispersion and consistency metrics to Week 2 baseline.20
    5Test alternate tempos: try 24/8 (faster) and 30/10 (slower). Hit 8 balls each. Compare TrackMan metrics.24
    6Lock in optimal tempo. Full 25-ball TrackMan session with your best-performing tempo. Wean off tones for final 5 swings.25

    How to Use the Audio Tones During Practice

    The Tour Tempo app plays three tones per swing. Tone 1 marks your takeaway start. Tone 2 marks top of backswing. Tone 3 marks impact. For the 27/9 setting, you’ll hear a rhythm that sounds roughly like: beep… beep… BEEP. The first two tones are spaced further apart (the backswing), the final tone comes quickly after the second (the downswing). Start each rep by pressing play, then beginning your swing on the first tone. Don’t try to match the tones consciously—just let them play and swing naturally while listening. After 10-15 reps, your nervous system will start syncing to the rhythm automatically. You’ll feel yourself ‘waiting’ for the second tone at the top and releasing on cue when the third tone fires.

    The most common mistake is trying to force the match. If you consciously slow down or speed up to hit the tones, you’ll create mechanical compensation patterns. Instead, swing freely and notice where your natural timing falls relative to the tones. Early in Week 1, you might be consistently late to the top (hitting your actual top position after tone 2) or rushing the downswing (impacting before tone 3). That’s fine. The feedback loop is what trains the adjustment.

    TrackMan Metrics to Track for Tempo Optimization

    Tempo training isn’t about hitting it farther—it’s about hitting it the same. The TrackMan metrics that matter most are consistency and predictability, not peak performance. Here’s what to monitor:

    • Swing Speed Standard Deviation: Your goal is ±2 mph or less across a 20-ball session. Pre-tempo, mine was ±8 mph. Post-tempo: ±1.8 mph.
    • Lateral Dispersion (offline distance): Measure how far left or right your shots finish from centerline. Pre-tempo average: 42 yards. Post-tempo: 25 yards.
    • Launch Angle Consistency: Should stay within ±2 degrees. Wild variance indicates inconsistent delivery. Mine tightened from ±4.5° to ±1.8°.
    • Smash Factor: This will improve as strike quality becomes more consistent. Target 1.48+ with driver. Mine improved from 1.42 to 1.48 average.
    • Spin Rate Variance: Should cluster within ±300 RPM. Tempo fixes delivery path, which stabilizes dynamic loft and attack angle.

    In Week 2, establish your baseline by hitting 20 drivers without the app—just your natural swing. Record all five metrics. Then in Week 4 and Week 6, repeat the 20-ball session with tempo tones active and compare. The improvement in standard deviation and dispersion is where tempo makes its case.

    Supporting Video Resources

    Master the 3:1 Ratio: Gain Speed and Consistency with Tour Tempo

    Stop overthinking your mechanics and start swinging with the rhythm of a tour pro!

    The Simple Secret to Carrying Your Driver 300+ Yards

    Learn how to optimize your impact to maximize every ounce of power in your swing

    Common Tempo Mistakes and How to Fix Them

    Mistake 1: Starting the app mid-swing

    The tones only work if you start moving on tone 1. If you press play and then wait to swing, you’ll be chasing the rhythm instead of syncing to it. Press play, hear tone 1, start your takeaway. The timing should feel like: tone = move, not move = tone.

    Mistake 2: Forcing mechanical changes to match the tones

    Don’t artificially slow your backswing or rush your downswing. Swing naturally and let the mismatch reveal itself. Your body will adjust over reps. If you consciously manipulate tempo, you’ll build compensation patterns that fall apart under pressure.

    Mistake 3: Jumping straight to ball striking

    Week 1 exists for a reason. If you skip the no-ball reps, you’ll be managing two learning curves simultaneously—tempo matching and strike quality. Separate them. Build the tempo pattern in a zero-consequence environment first.

    Mistake 4: Sticking with one tempo without testing alternatives

    The 27/9 setting is the statistical mode, but it’s not universal. Some players naturally swing faster or slower. Week 5 is designed to test this. Hit balls with 24/8 and 30/10 and see which produces better TrackMan consistency. The right tempo is the one where your metrics tighten, not the one that “feels” right.

    Final Word

    The Tour Tempo app costs $24.99. A single TrackMan session at most facilities in Connecticut runs $40-60 (or free if you have a membership at Golf Lab CT). Total investment for this protocol: under $300 if you’re paying for range time and TrackMan access. The ROI isn’t measured in yards gained—it’s measured in fairways hit, greens in regulation, and strokes saved from eliminating the catastrophic miss.

    Tempo is the invisible variable in the golf swing. You can’t see it on video. It doesn’t show up in a mirror. But it governs everything—transition timing, sequencing, strike quality, consistency. The Tour Tempo app makes the invisible visible by giving you an external reference point. The TrackMan validates that the timing improvements are transferring to ball flight.

    I’ve used this protocol twice now—once in the fall and once during an off-season reset. Both times, the dispersion numbers improved by 35-40%. Both times, the consistency metrics tightened significantly. And both times, the gains carried into actual rounds. If you’ve ever felt like your swing is different every day, like you don’t know which version of yourself is showing up on the first tee, tempo training is the answer. It won’t make you longer. But it will make you the same. And in golf, being the same is often better than being great.

  • HH Golf Stick and Pressure Plate Build Real Swing Speed

    HH Golf Stick and Pressure Plate Build Real Swing Speed

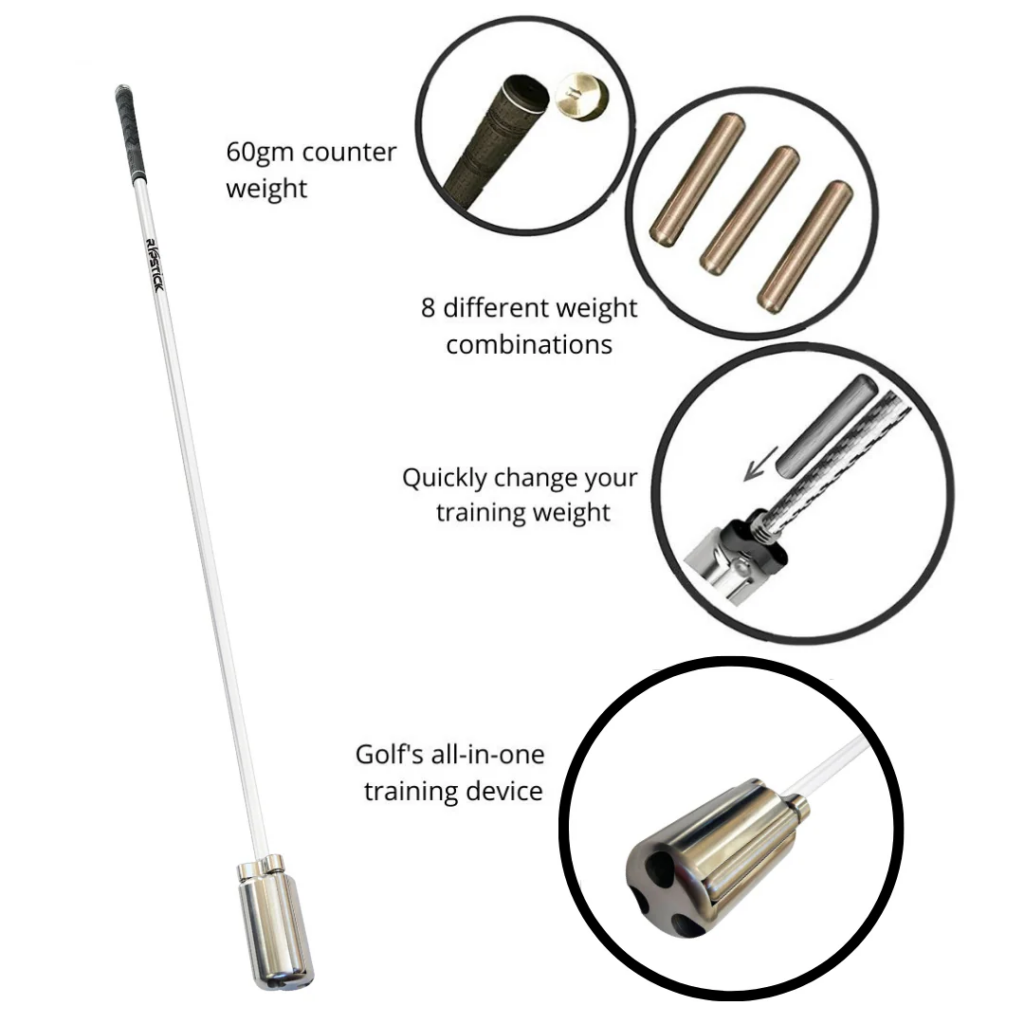
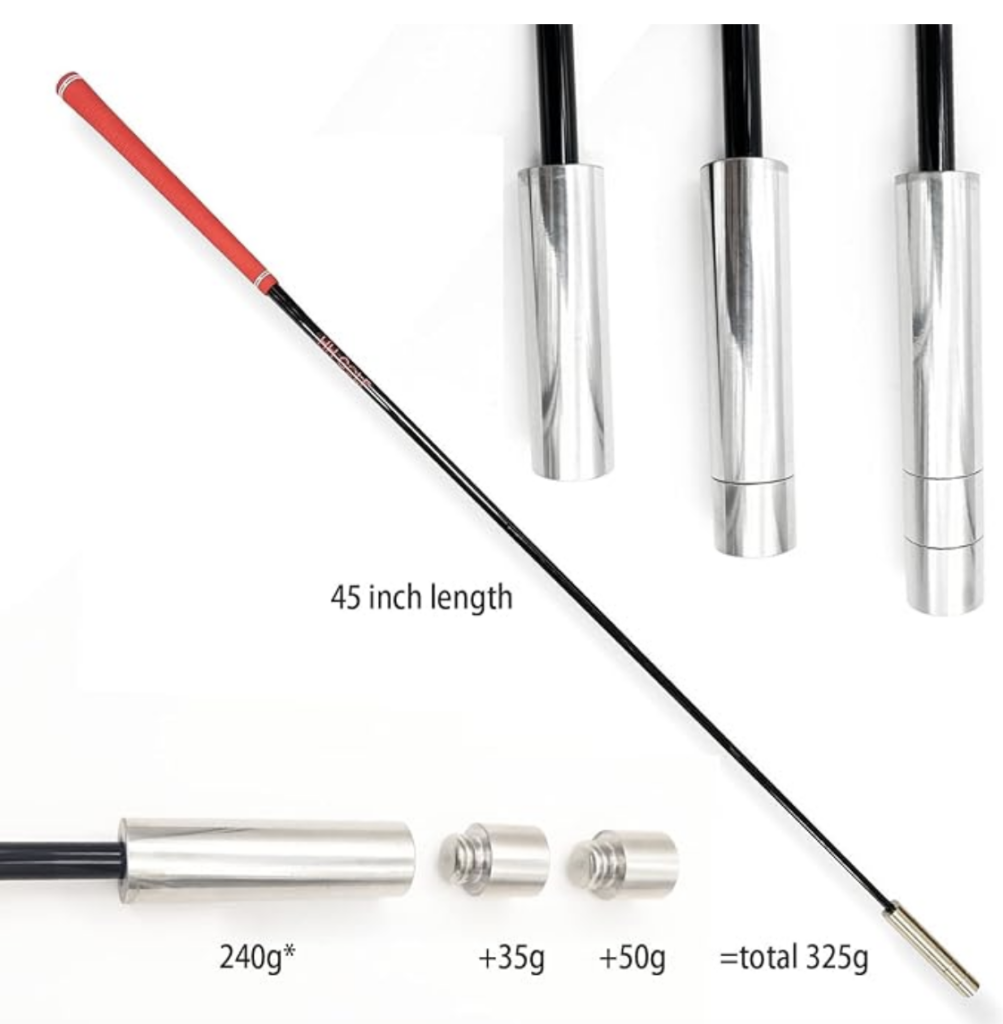
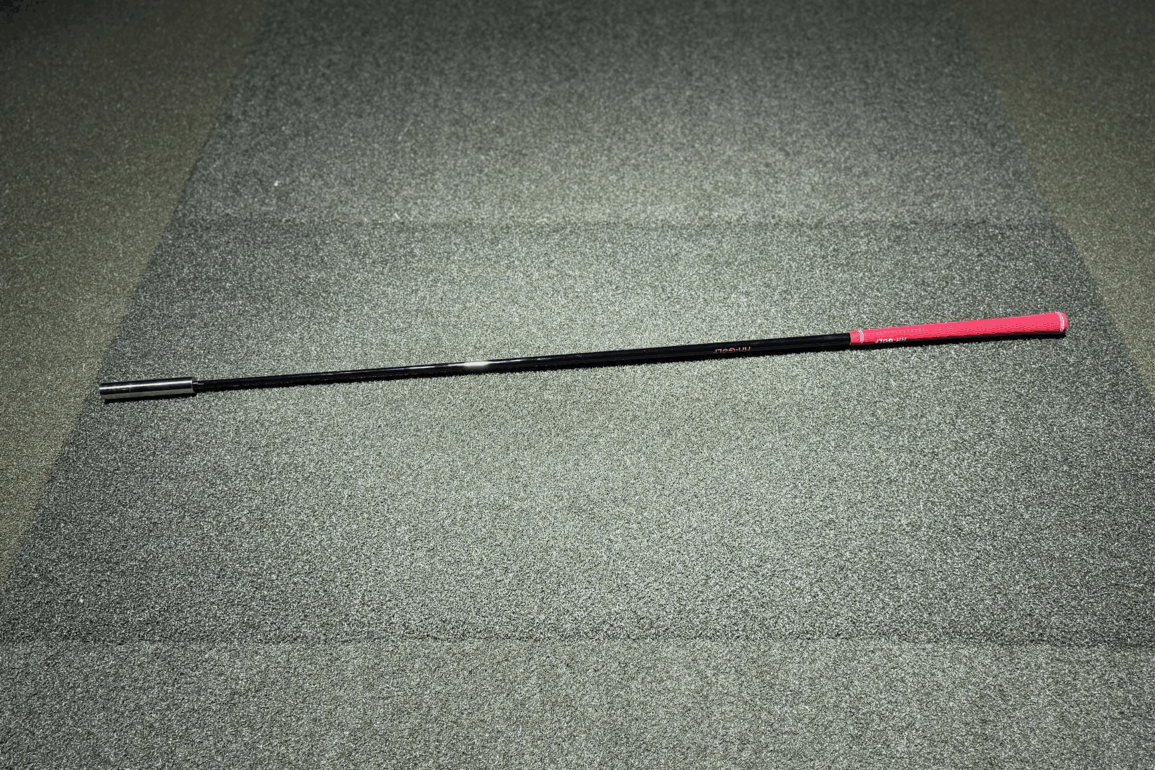
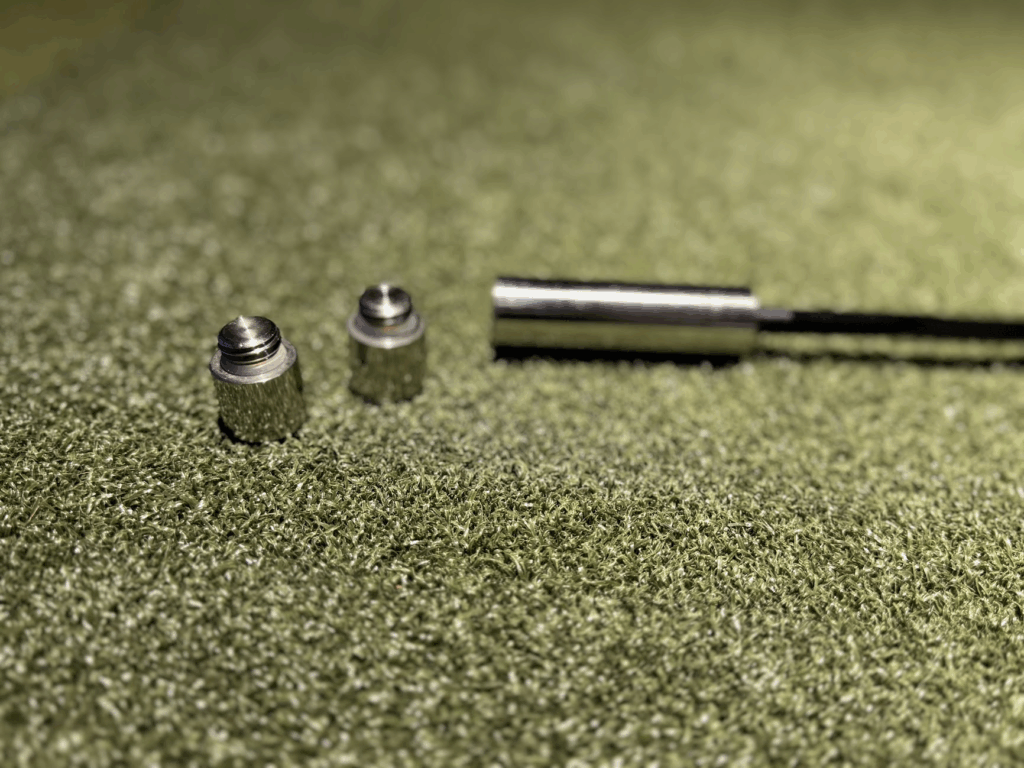
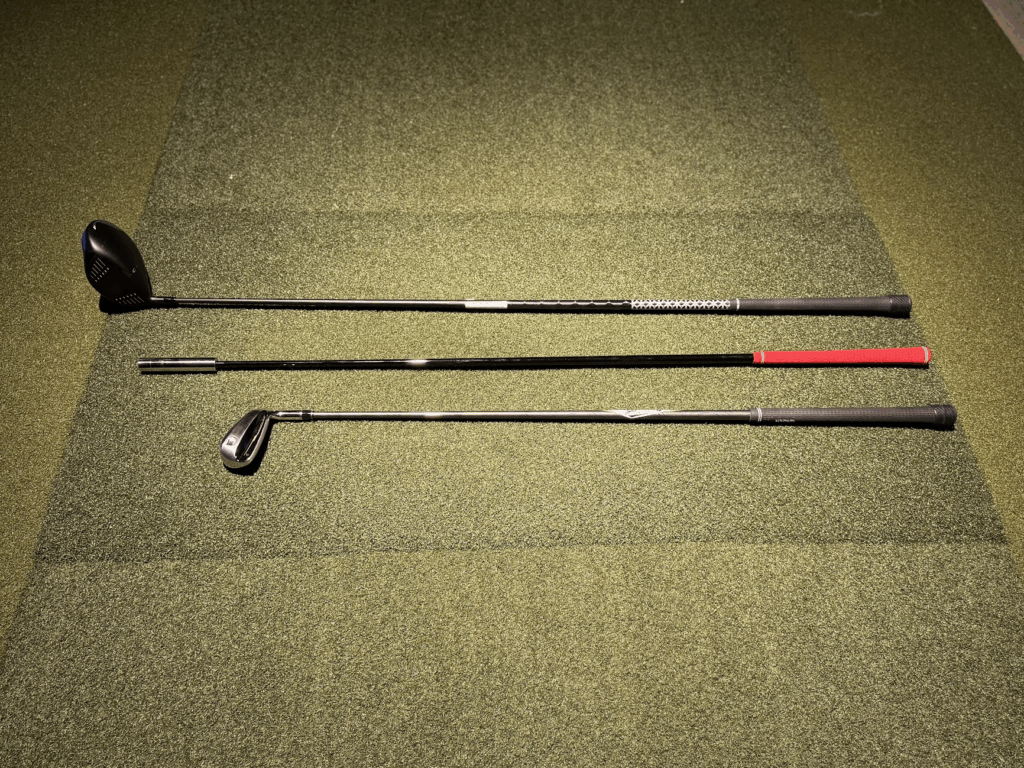
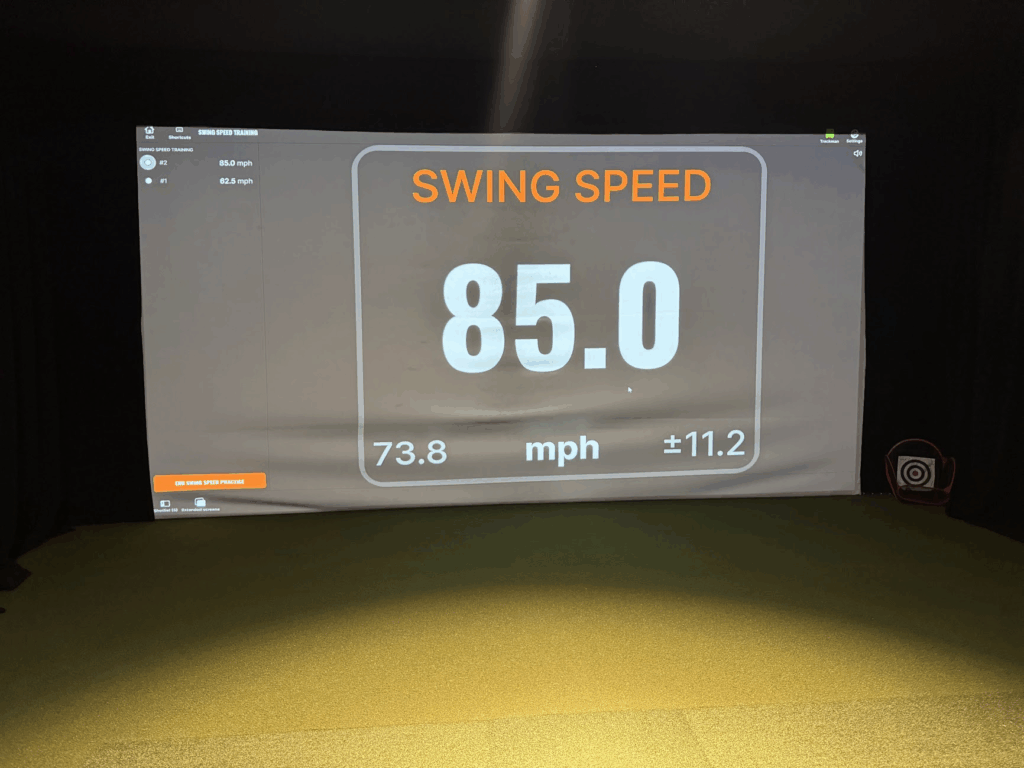
    There’s a gap between knowing you need more swing speed and actually building it in a way that transfers to the course. I spent most of last year chasing that gap. I’d bought the HH Golf Swing Speed Trainer after getting tired of watching $250+ speed sticks do essentially the same thing—overspeed loading across three weight configurations. The HH stick delivered. Within a few weeks, I’d gone from 81 mph to 85 mph on TrackMan, and that alone was worth the $30.

    But speed without ground force is just flailing. I noticed that while my peak velocities were climbing, my ball speed wasn’t keeping pace. Strike quality was inconsistent. I was swinging faster but not transferring that energy into the ball efficiently. That’s where the pressure plate changed everything.

    By pairing the HH Golf stick with a pressure plate—I use the WhyGolf model, though any rocker-style plate works—I was able to simultaneously train neuromuscular speed and the weight shift mechanics that allow you to actually use that speed at impact. The combination is, in my experience, the single best off-season training stack a Connecticut golfer can own. Here’s the protocol I built and how to implement it yourself.

    Why This Works

    The HH Golf stick trains your nervous system to fire faster through overspeed principles. You swing a lighter implement to override your body’s natural governor on rotational velocity. Then you swing a heavier one to build strength at the new speed threshold. Published data from independent testing shows average gains of 4.7 mph over eight weeks with three sessions per week. The problem is that speed training in isolation tends to create disconnected movement patterns. Golfers develop faster hands and torso rotation, but their lower body doesn’t adapt in sync. The pressure plate solves this by providing instant tactile feedback on whether your weight is shifting forward at the right time. Think of it this way: the speed stick builds the engine, and the pressure plate teaches you how to put it in gear.

    The 8-Week Speed and Pressure Protocol

    I structured this as a progressive protocol that layers the pressure plate into your existing speed work. Weeks 1–2 focus on pure overspeed adaptation. Weeks 3–4 introduce pressure plate awareness. Weeks 5–8 integrate both tools simultaneously and push toward peak speed with optimized ground force timing. Each session takes 15–20 minutes. Three sessions per week is the minimum effective dose.

    The progression from isolated speed work to integrated pressure-plate swings is intentional. If you introduce the plate too early, you’ll subconsciously throttle your speed to “get the timing right.” Build the speed ceiling first, then teach your body to use it with proper ground mechanics.

    HH Stick Protocol by Week

    WeekHH Stick WorkSwings
    1–2Light weight only. 3 sets of 5 dominant-side swings. Max intent, maintain balance.15
    3–4Light → Medium → Heavy sequence. 2 sets of 3 per weight. Add 5 non-dominant hand swings.18
    5–6Full spectrum: L → M → H → M → L. 3 sets of 3. Add “freezer at top” drill on heavy.21
    7–8Full spectrum, 4 passes. Add lead heel lift drill. Max intent every swing.24 + 10

    Pressure Plate Integration by Week

    WeekPressure Plate WorkRest
    1–2None. Establish baseline speed numbers on TrackMan.90 sec
    3–4Separate session: 20 half-speed 7-iron swings on plate. Focus on hearing the tip at transition.60 sec
    5–6Stand on plate during light-weight stick swings. Confirm plate tips at transition every rep.45 sec
    7–8Full integration: all stick swings on plate. Alternate sets between stick and driver.60 sec

    Supporting Video Resources

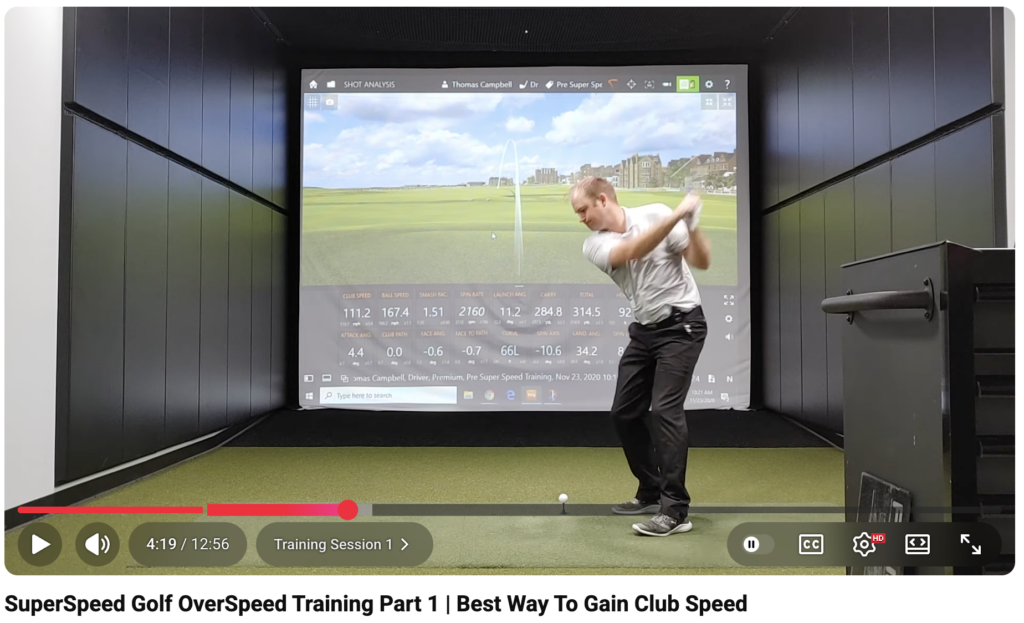
    SuperSpeed Golf Swing Speed — Level 1 Training Protocol

    SuperSpeed Golf’s Level 1 protocol walkthrough — the same light-medium-heavy sequencing used in this HH Golf Stick program.

    Athletic Motion Golf — How to Use the Ground to Generate SPEED in Your Golf Swing

    Athletic Motion Golf breaks down how tour pros use ground force versus amateurs — the exact mechanic the pressure plate trains during this protocol.

    Pressure Plate Setup and Mechanics

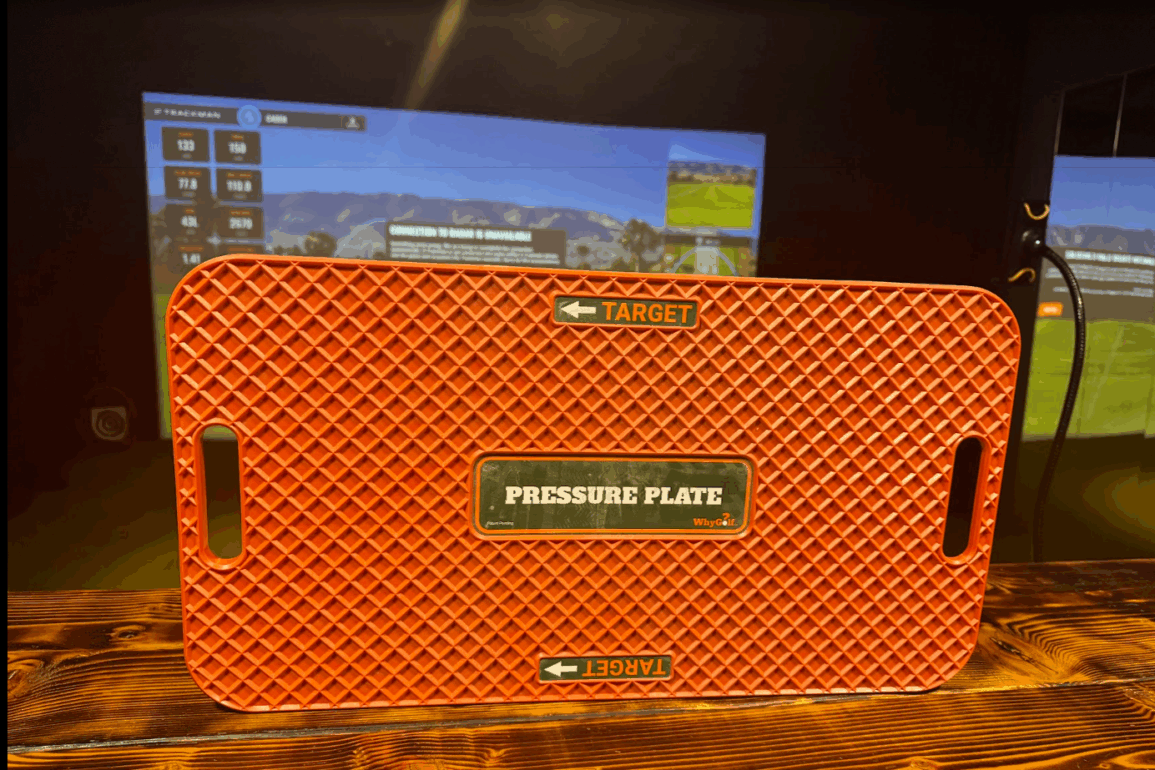
    Place the WhyGolf Pressure Plate under your lead foot (left foot for right-handed golfers), arrows pointing toward the target. Position it so the pivot point sits roughly under the ball of your foot—not your heel, not your toes. This ensures the tipping action corresponds to genuine forward pressure shift, not just ankle roll. During your backswing, the plate should remain neutral or tip slightly back. At transition—the split second where your lower body starts firing toward the target while the club is still going back—the plate should audibly and physically tip forward.

    I recorded my sessions on video and synced the footage with TrackMan data. On swings where the plate tipped early in transition, my ball speed jumped by 3–5 mph compared to swings where the tip was late—even though swing speed was nearly identical. That’s the efficiency the pressure plate trains.

    Combining with Real Club Work and Validating Transfer

    Starting in Week 5, I began hitting actual balls while standing on the pressure plate. This is where you validate that the speed gains from the HH stick are transferring. Start with 5 swings using the light-weight HH stick on the plate with no ball—pure activation swings to wake up the nervous system and confirm the plate tips at transition. Then switch to your driver or 7-iron and hit 10 balls in TrackMan’s Shot Analysis mode. Watch three numbers: swing speed, ball speed, and smash factor. If your smash factor is above 1.45 with the driver, your ground force timing is working. If it’s below 1.40, your speed gains haven’t integrated yet—go back to the plate-only drills.

    Over the full 8-week protocol, swing speed gains of 3–6 mph are typical. I gained 4 mph on the stick and saw roughly 3.5 mph carry over to my actual driver. The pressure plate work improved my smash factor from 1.41 to 1.47, which translated to an additional 8–10 yards of carry even before the speed gains are factored in. Combined, I picked up about 15 yards of driver carry.

    The less quantifiable benefit is tempo consistency. Speed training can make your swing feel jerky and rushed if you’re not anchoring it with proper sequencing. The pressure plate prevents this by giving your body a physical checkpoint every single rep. After Week 6, my transition felt noticeably smoother, and my miss pattern tightened.

    Key Metrics to Track Throughout the Protocol

    • Swing speed (TrackMan or app): expect +3–6 mph over 8 weeks
    • Ball speed: should rise proportionally; if it lags, ground force timing is off
    • Smash factor: target 1.45+ with driver; the pressure plate’s primary contribution
    • Carry distance: the final proof — expect +12–18 yards combined
    • Plate tip timing: should occur at transition, not early backswing or late downswing

    Final Word

    The HH Golf Swing Speed Trainer runs about $30–$35 on Amazon. The WhyGolf Pressure Plate is $99. Total investment: roughly $130. For comparison, a SuperSpeed system alone is $199–$299, and a force plate system like BodiTrak or Swing Catalyst runs $1,000+. If you already have simulator access, this is the highest-ROI training aid combination I’ve found.

    Speed training without ground force awareness is incomplete. The HH Golf Stick will make you faster, and the numbers will prove it. But if you’re not simultaneously teaching your body where to put that speed—into the ball through proper weight shift and sequencing—you’ll leave yards on the table. The pressure plate closes that loop. It turns a $30 speed stick into a legitimate performance system.

    I’ve run through this protocol twice now, once in late fall and once over the winter. Both times, the gains carried into my first rounds of the spring season. That’s the test that matters—not whether you can swing a weighted stick 5 mph faster in a simulator bay, but whether you can hit it 15 yards past your old mark on Hole 1 when it counts. For me, the answer has been yes. I suspect it will be for you too.

  • Blast Motion Golf Sensor: How Accurate is it?

    Blast Motion Golf Sensor: How Accurate is it?

    I genuinely love the concept behind the Blast Motion golf sensor. The idea of democratizing swing analysis through an affordable, portable device that clips onto any club is exactly the kind of innovation golf needs. Being able to track your practice sessions, monitor swing changes over time, and get immediate feedback without booking time on a $30,000 TrackMan is compelling for golfers at every level.

    How accurate are all these metrics?

    However, after extensive testing against TrackMan validation and examining the underlying physics of how grip-mounted sensors work, it’s clear that Blast Motion needs to provide far more transparency about the variance of their measurements—particularly when using different clubs with different shaft characteristics. The technology is solid for certain applications, but golfers deserve to understand the accuracy limitations before relying on the data for equipment decisions or swing changes.

    What Blast Motion Measures

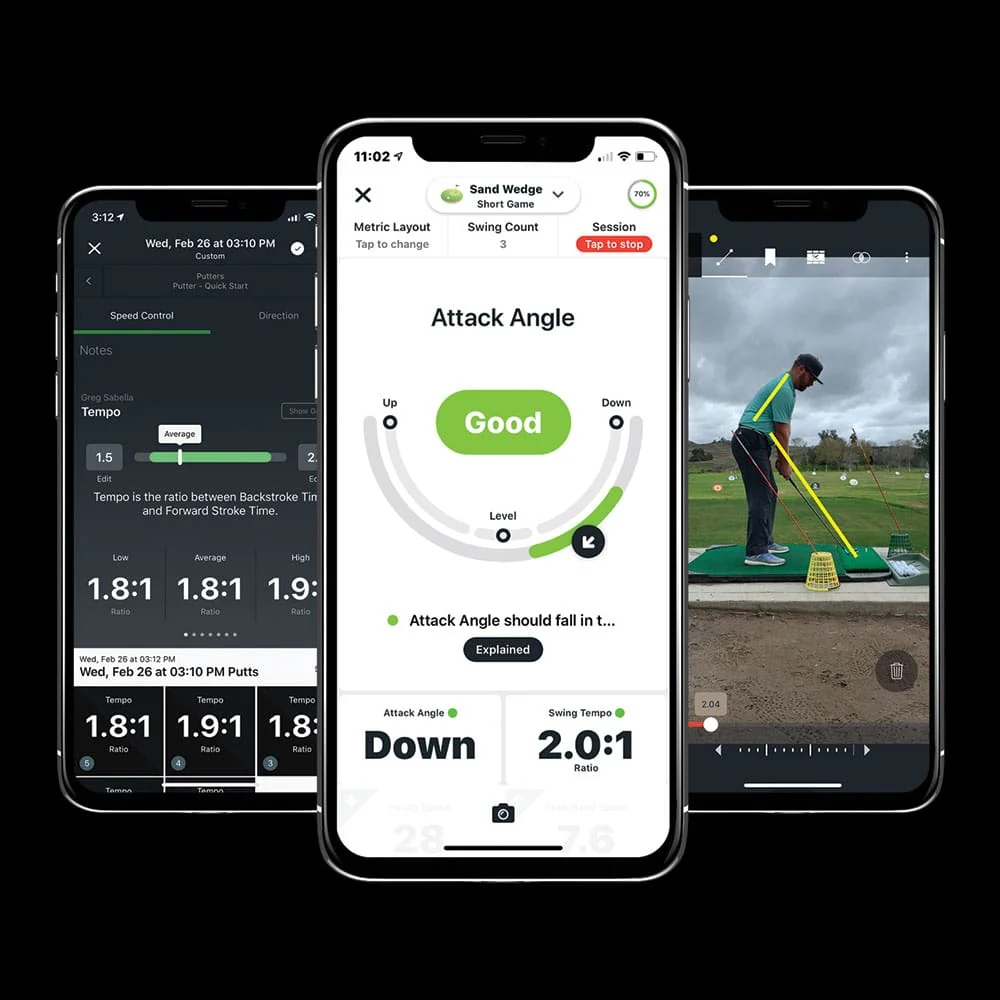
    The Blast Motion sensor is a six-axis Inertial Measurement Unit (IMU) containing a three-axis accelerometer and three-axis gyroscope. Mounted at the butt end of the grip, it records angular velocity and linear acceleration throughout the swing. The device then applies proprietary algorithms to calculate various swing metrics:

    MetricDescriptionMeasurement Type
    Club Head SpeedSpeed of club head at impactCalculated (claimed ±1 mph)
    Backswing TimeDuration from takeaway to topDirect measurement
    Downswing TimeDuration from transition to impactDirect measurement
    TempoRatio of backswing to downswing timeDirect measurement
    Time to ImpactTotal swing durationDirect measurement
    Attack AngleVertical approach angle at impactCalculated estimate
    Swing PlaneClub path through the swingCalculated estimate

    The key distinction is between direct measurements and calculated estimates. Unlike launch monitors that directly measure club head speed via Doppler radar (TrackMan, FlightScope) or high-speed cameras (GCQuad, Foresight), Blast Motion must calculate what’s happening 40+ inches away at the club head based on measurements taken at the grip.

    The Fundamental Accuracy Problem

    Why Grip-Mounted Sensors Can’t Accurately Measure Club Head Speed

    The physics here are unforgiving. To calculate club head speed from grip-end measurements, Blast Motion must:

    1. Integrate angular velocity data over time to determine shaft rotation
    2. Apply assumptions about shaft length and flex characteristics
    3. Account for shaft deflection and lag during the downswing
    4. Estimate the complex three-dimensional path of the club head

    Each step introduces cumulative error. The most problematic is shaft behavior. During the downswing, a golf shaft isn’t a rigid rod—it’s a complex dynamic system that bends, twists, and exhibits different flex profiles depending on load, torque, and the player’s release pattern. The same grip rotation can produce vastly different club head speeds depending on shaft characteristics and swing dynamics.

    TrackMan Validation Testing

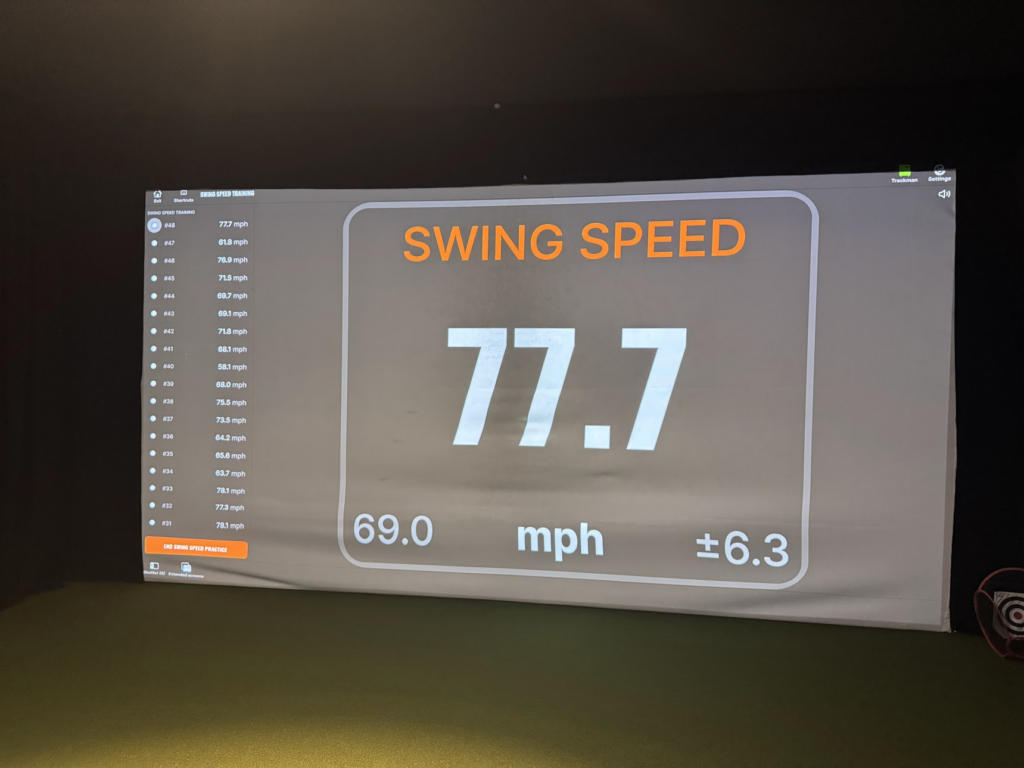
    To understand Blast Motion’s real-world accuracy, I tested it alongside TrackMan 4’s speed training function and also validated against the Superspeed doppler radar system. Both are considered gold standards for club head speed measurement.

    Trackman has a great swing speed trainer with single source of truth

    The results showed considerable variance across multiple clubs and swing speeds. Blast Motion consistently underestimated club head speed by 2-4 mph compared to both TrackMan and Superspeed, with the discrepancy increasing on longer clubs (driver showing the largest gap). More concerning was the swing-to-swing consistency—while TrackMan showed standard deviations under 1.2 mph, Blast Motion exhibited nearly double that variability.

    This isn’t just random noise. It’s systematic bias stemming from the fundamental challenge of calculating club head behavior from grip-end measurements, compounded by different shaft characteristics across clubs.

    The Critical Need for Transparency on Club-to-Club Variance

    Here’s where Blast Motion falls short on consumer disclosure: they don’t adequately communicate how measurement accuracy varies dramatically across different clubs and shaft configurations. The ±1 mph accuracy claim appears prominently in marketing materials, but there’s no asterisk explaining that this only applies under specific conditions with specific shaft types.

    The reality is that accuracy depends heavily on multiple variables:

    FactorImpact on Accuracy
    Shaft LengthLonger shafts (45″+ driver) introduce more integration error than shorter shafts (35″ wedge)
    Shaft FlexRegular flex deflects differently than extra stiff, changing grip-to-clubhead relationship
    Shaft WeightLightweight graphite (50-60g) vs. steel (120-130g) affects loading patterns
    Kick PointLow kick shafts bend differently than high kick, altering energy transfer timing
    Release PatternEarly releasers vs. late releasers create different shaft loading profiles
    Swing SpeedHigher speeds amplify shaft deflection and magnify measurement errors

    Blast Motion should provide accuracy specifications for each club type. Something like:

    Club TypeTypical Variance vs. Radar
    Driver (graphite, regular-stiff flex)±2-4 mph
    Fairway Woods±2-3 mph
    Long Irons (graphite)±2-3 mph
    Mid Irons (steel)±1.5-2.5 mph
    Short Irons/Wedges (steel)±1-2 mph

    They should also disclose that swing-to-swing precision is lower than radar systems. If you’re testing different driver shafts and see a 2 mph difference between them with Blast Motion, you can’t confidently say whether one shaft actually produces more speed or if you’re seeing measurement noise.

    More importantly, Blast Motion should provide users with a calibration protocol: “Take 10 swings with your driver on a TrackMan or GCQuad. If Blast Motion reads 3 mph slow on average, you can apply a +3 mph correction factor for that specific club.” This would at least give users accurate relative feedback with their own equipment.

    The current approach—presenting the data as universally accurate across all clubs and configurations—sets unrealistic expectations and can lead golfers to make poor equipment decisions based on systematically biased measurements.

    What Blast Motion Measures Accurately

    It’s worth noting that Blast Motion’s timing-based metrics are genuinely accurate. Backswing time, downswing time, and tempo ratios don’t require calculating what’s happening at the club head—they’re based purely on grip rotation rates, which the IMU measures directly.

    For golfers working on tempo consistency (maintaining a 3:1 backswing-to-downswing ratio, for example), Blast Motion provides reliable, actionable feedback. These measurements showed excellent correlation with video analysis timing and are probably the sensor’s most valuable output for serious practice.

    How to Improve Measurement Accuracy: Engineering Solutions

    Solution 1: Club Head-Mounted IMU for Direct Measurement

    The most direct path to accuracy is measuring at the point of interest. A club head-mounted IMU would eliminate all shaft deflection variables and provide direct measurements of:

    • Club head speed (actual, not calculated from grip rotation)
    • Attack angle (precise vertical approach path)
    • Club path (true swing direction through impact)
    • Face angle at impact (critical for ball flight prediction)
    • Acceleration profile through the impact zone
    • Impact location detection (center vs. toe/heel strikes)

    Engineering Challenges:

    • Extreme g-forces – The club head experiences 1,000+ Gs during the downswing and 3,000-4,000 Gs at ball impact, requiring ruggedized sensors rated for high-shock environments
    • Weight constraints – Adding even 10-15 grams to the club head affects swing weight and feel; sensor package must be <5g
    • Power management – Battery must survive thousands of swings in a compact, lightweight package
    • Data transmission – Bluetooth signal integrity during high-speed rotation presents challenges
    • Durability – Housing must withstand repeated impacts without affecting club performance
    • Installation – Retrofitting existing clubs becomes impractical; would require selling integrated club heads or complete clubs

    Potential Implementation:

    A club head sensor could be embedded in the back cavity of irons or in the crown/sole of woods. Modern composite construction techniques allow for small sensor pockets that don’t compromise structural integrity. The sensor would transmit data post-swing to a grip-mounted receiver/battery pack that handles communication and charging.

    Accuracy improvement: This approach could achieve ±0.5 mph accuracy, comparable to camera-based launch monitors, because it eliminates all shaft-related variables.

    Solution 2: Standardized Club System

    A more practical near-term solution: pair the grip-mounted sensor with a standardized shaft whose flex characteristics are precisely known and calibrated.

    How It Would Work:

    • Blast Motion provides a calibrated reference shaft (or several for different swing speeds)
    • Shaft specifications (length, flex profile, torque, weight) are precisely measured and encoded in the sensor firmware
    • Algorithms are optimized specifically for this known shaft’s deflection behavior
    • Users attach their driver/iron heads to the standard shaft for measurement sessions
    • System could include multiple shafts: driver length, iron length, wedge length

    Accuracy Benefits:

    • Eliminates shaft variability as primary error source
    • Allows algorithms to model exact deflection patterns under load
    • Could reduce club head speed error from ±3-4 mph to ±1 mph or better
    • Maintains affordable grip-sensor technology (no expensive club head sensors)
    • Provides consistent baseline for tracking improvement over time

    Practical Considerations:

    • Less convenient than universal clip-on approach
    • Requires users to swap club heads (only works with removable hosels)
    • Doesn’t measure performance with your actual gamer shafts
    • Need to calibrate for different head weights (200g driver vs. 250g iron)

    Implementation Path:

    Blast Motion could offer a “Pro Accuracy Kit” that includes the sensor plus 2-3 calibrated shafts at different lengths. Users would get precise measurements for general swing development, then occasionally validate their game clubs on a launch monitor to understand real-world performance differences due to their specific shaft setups.

    Accuracy improvement: With optimized algorithms for a known shaft, this could achieve ±1 mph accuracy, a significant improvement over current ±3-4 mph variance.

    Solution 3: User Calibration and Enhanced Algorithms

    The most immediately implementable improvement: leverage software updates to reduce systematic errors through better modeling and personalized calibration.

    User Calibration Protocol:

    • Initial setup requires 10-20 swings on a validated launch monitor (TrackMan, GCQuad, etc.)
    • App collects paired data: Blast Motion measurements + verified club head speeds
    • Algorithm generates club-specific and player-specific correction factors
    • System learns your release pattern, shaft loading characteristics, and swing dynamics
    • Periodic re-calibration recommended (quarterly or when changing equipment)

    Enhanced Shaft Modeling:

    • Detailed shaft database with flex profiles for common models (Fujikura, Project X, KBS, etc.)
    • Users input specific shaft information: manufacturer, model, flex, length, weight
    • Algorithms apply shaft-specific deflection models instead of generic assumptions
    • Accounts for differences between graphite vs. steel, high vs. low kick point, etc.

    Machine Learning Refinement:

    • Train neural networks on large datasets of paired grip-sensor + launch monitor measurements
    • Learn patterns in how different shaft types, swing speeds, and release timings affect grip-to-clubhead relationships
    • Continuously improve algorithms as more users contribute calibration data
    • Implement adaptive models that refine accuracy as they collect more swings from each individual user

    Real-Time Confidence Intervals:

    • Display measurement uncertainty with each reading (e.g., “106 mph ±2 mph”)
    • Wider intervals for unfamiliar shaft types or unusual swing patterns
    • Narrower intervals after calibration with validated equipment
    • Helps users understand when measurements are reliable vs. when to seek verification

    Accuracy improvement: User calibration could reduce mean error from 3-4 mph to under 1 mph for calibrated clubs. Enhanced algorithms and shaft modeling could reduce swing-to-swing variance from 2+ mph to 1-1.5 mph, approaching the precision of radar systems while maintaining the convenience of grip-mounted sensors.

    Comparing the Three Approaches

    SolutionAccuracy & DifficultyCost & Convenience
    Club Head-Mounted IMU±0.5 mph accuracy (best)
    Very high implementation difficulty
    Significant cost increase
    Low convenience (requires integrated clubs)
    Standardized Calibration Shaft±1 mph accuracy (good)
    Medium implementation difficulty
    Moderate cost increase
    Medium convenience (requires club swapping)
    User Calibration + ML±1-1.5 mph accuracy (good)
    Low implementation difficulty
    Minimal cost increase
    High convenience (one-time setup)

    Recommendations for Blast Motion Users

    If you currently own or are considering Blast Motion, here’s how to get the most accurate and useful data:

    Appropriate Use Cases

    Use CaseBlast Motion Suitable?Notes
    Tempo and timing work✓ ExcellentDirect measurements are highly accurate
    Tracking speed improvements over time✓ GoodRelative changes are reliable even if absolute values are off
    Practice motivation and gamification✓ GoodApp interface makes practice engaging
    Shaft fitting and comparison✗ PoorVariance too high to detect 1-2 mph differences reliably
    Equipment decision-making✗ PoorSystematic bias makes absolute values unreliable
    Comparing to tour averages✗ PoorNeed calibration against verified system first
    General swing monitoring△ FairUseful after establishing personal baseline

    Validate Your Baseline

    Take your Blast Motion to a facility with TrackMan or GCQuad. Hit 10 swings each with your driver, 7-iron, and wedge. Note the systematic difference between the two systems. If Blast consistently reads 3 mph slow with your driver, you can mentally add 3 mph to future readings with that specific club and shaft combination.

    Focus on Relative Changes

    Even if absolute speeds are off, Blast Motion can reliably track whether you’re gaining or losing speed over time. If your readings go from 104 mph to 107 mph over three months of training, you’ve genuinely gained speed—even if your actual speeds were 108 mph and 111 mph.

    Use Timing Metrics Extensively

    The tempo, backswing time, and downswing time measurements are highly accurate and valuable for swing development. These metrics show excellent correlation with high-speed video analysis and can help you build consistency in your swing timing.

    Calibrate for Equipment Decisions

    Never rely solely on Blast Motion for shaft fitting or equipment comparisons. If testing two driver shafts and see a 2 mph difference, you’re within the measurement error. Get those decisions validated on a professional launch monitor where you can trust 1 mph differences.

    Track Swing Changes Carefully

    When working on swing modifications, take multiple swings (20+) before and after changes to overcome measurement variance. Statistical averaging helps separate real changes from noise.

    Final Thoughts

    I genuinely appreciate what Blast Motion is trying to accomplish. Making swing data accessible to everyday golfers without requiring $30,000 launch monitors or $200/hour facility time is important for the game’s growth and development. The technology is clever, the app is well-designed, and for certain applications—especially tempo and timing work—it delivers real value.

    But Blast Motion needs to be more transparent about measurement accuracy, particularly how variance changes across different clubs and shaft types. Golfers deserve to know that the ±1 mph accuracy claim comes with significant caveats. They should understand that a grip-mounted sensor fundamentally cannot match the precision of direct measurement systems.

    The three solutions I’ve outlined—club head mounting, standardized calibration shafts, and enhanced user calibration—all represent viable paths to improved accuracy. The engineering challenges are real but not insurmountable. With modern IMU technology, machine learning algorithms, and thoughtful calibration protocols, grip-mounted sensors could achieve accuracy levels that make them genuinely useful for equipment fitting and detailed swing analysis.

    Until those improvements arrive, I recommend using Blast Motion for what it does well: tracking practice volume, monitoring tempo consistency, and providing general feedback on swing trends. Validate your baseline against TrackMan, understand the limitations, and supplement with periodic launch monitor sessions when you need precise data for equipment or swing decisions.

    The concept is sound. The execution needs refinement. With greater transparency and some engineering investment in improved accuracy, Blast Motion could evolve from a practice motivation tool into a genuinely reliable measurement system that golfers can trust for critical decisions.

  • The $129 Blue Brick: Why Are You Paying $90 for Drilled Holes?

    The $129 Blue Brick: Why Are You Paying $90 for Drilled Holes?

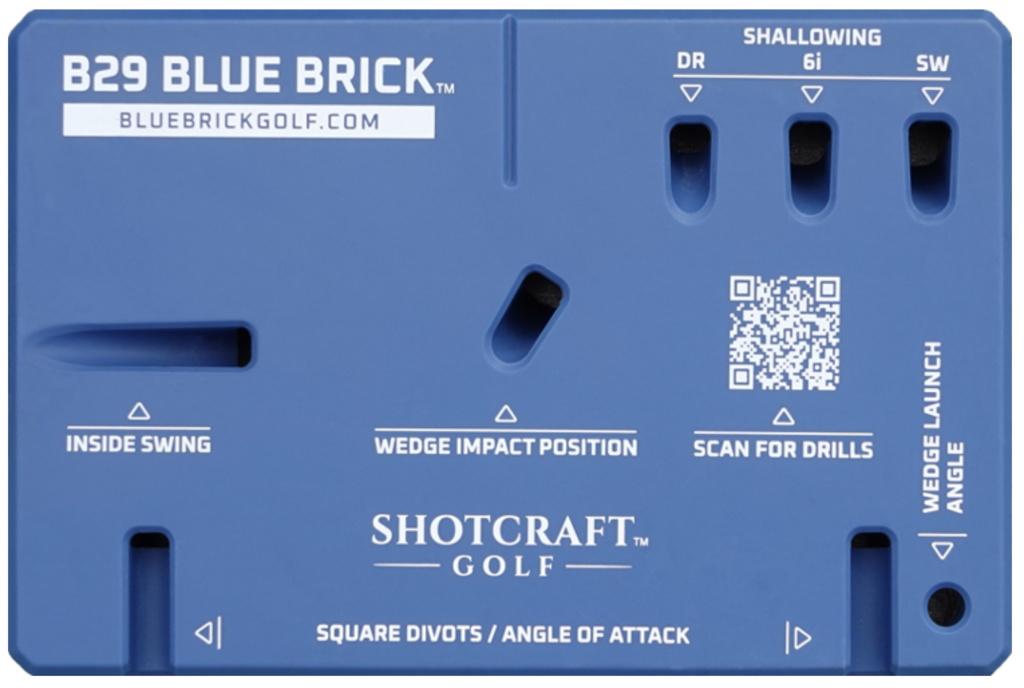
    If the Stack Speed Training System represents golf equipment pricing at its most absurd, then the B29 Blue Brick is running a close second. At $129 (marked down from $169—what a deal!), this “revolutionary” training aid is essentially a block of material with precisely angled holes drilled into it. That’s it. No electronics, no moving parts, no proprietary technology. Just a heavy base with some holes at specific angles that you stick alignment rods into.

    Why is this $169?!

    Let’s be absolutely clear about what you’re buying: a paperweight with engineering. Yes, the angles are based on tour player data. Yes, it’s heavier and sturdier than a 3D printed version. But at the end of the day, you’re being asked to pay $129 for something that costs under $10 in materials and can be replicated in an afternoon with basic tools or a 3D printer. The markup is staggering, and unlike the Stack system which at least pretends to offer an app ecosystem, the Blue Brick doesn’t even have that fig leaf to hide behind.

    What You’re Actually Getting

    The Blue Brick marketing describes it as an “11-in-1″ training system with slots for different clubs and swing functions. The weight specifications are 8.5″ x 5.5″ x 1.5”, weighing about 3 pounds, with a metal base plate for stability. It comes with two collapsible alignment sticks and access to instructional videos. The key selling point is that the angles are “precisely engineered” based on tour pro data—specifically, that tour pros shallow their downswing to approximately 60° with a 6-iron, 45° with a driver, and slightly steeper with wedges due to shorter shaft lengths.

    Here’s the thing though: once you know these angles (which are now public knowledge thanks to their marketing), there’s nothing stopping you from creating your own version. The “proprietary” angles aren’t proprietary anymore—they’ve told everyone exactly what they are. A 60° angle for a 6-iron? Great, I can measure that. A 45° angle for driver? Noted. The entire value proposition collapses once you realize the “secret sauce” is just trigonometry that’s been published on their website and in every review.

    Your Three Better Options

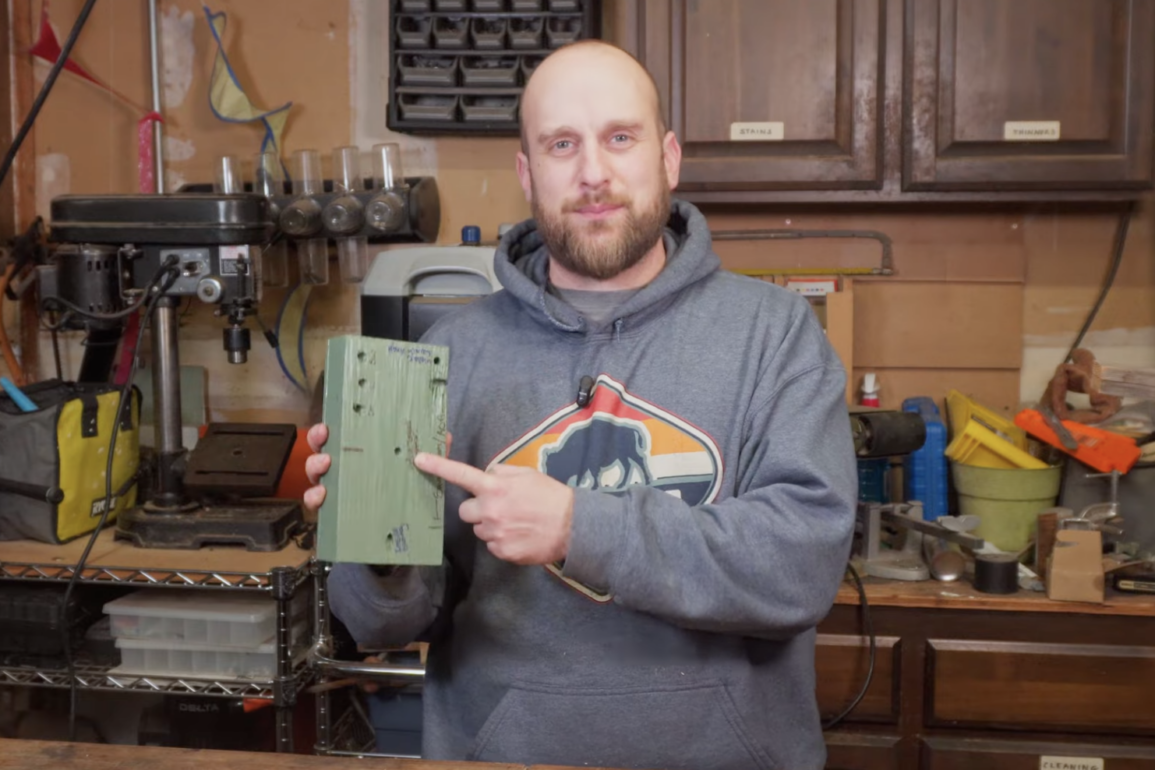
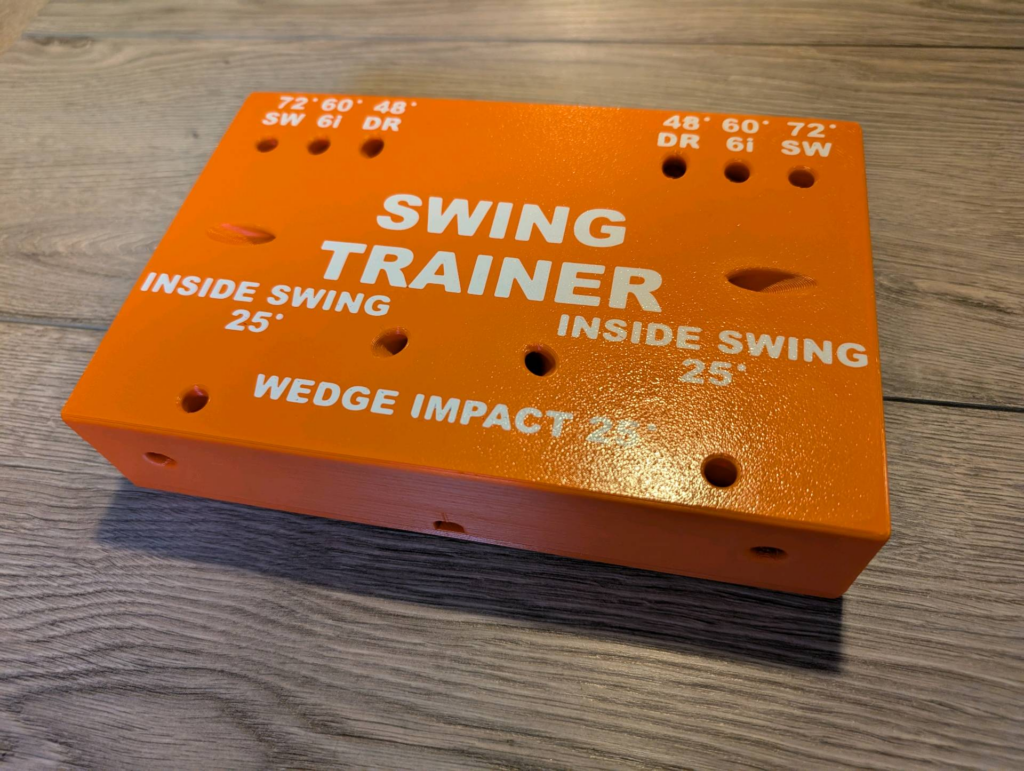
    YouTube creator Matthew Ryan from Project Golf built his own Blue Brick for approximately $40, as documented in his video “I Built a $150 Golf Swing Trainer for $40.” His materials list includes a 2×6 board at least 8.5 inches long, four pieces of 8.5-inch flat bar (1 inch wide by 1/4 inch thick), two-part epoxy, paint, and two alignment sticks. The build process involves cutting the lumber to size, drilling holes at the correct angles (48°, 60°, and 70° for the various shallowing positions, plus additional angles for inside path and wedge work), attaching the flat bar pieces for weight and stability, and finishing with epoxy and paint. Total time investment: about 8 hours including design and measurement. Total cost: $40 including the alignment sticks.

    MaterialDIY CostBlue Brick Cost
    2×6 lumber (8.5″ piece)$3-5Included
    4x flat bar pieces$15-20Included
    Epoxy$5N/A
    Paint$5-8N/A
    2 alignment sticks$8-12Included
    Total$36-50$129

    But here’s where it gets really interesting: the 3D printing community has completely reverse-engineered the Blue Brick and made it available for free. On MakerWorld, user_1419251669 uploaded a detailed 3D printable version with several key improvements over commercial alternatives. The design features a much larger base for stability, more area to fill with weighted material (sand, gravel, or Quikrete concrete mix), customizable hole sizes for different alignment stick diameters (7.8mm to 9.4mm in 0.1mm increments), and a secure bottom cover system using M4 threaded inserts and machine screws. The designer even included hole gauge models so you can test-fit your specific alignment sticks before committing to the final print.

    Print this and a couple of dowels for $15

    The MakerWorld model has received overwhelmingly positive reviews, with users reporting that it prints perfectly in 14-20 hours depending on settings, costs $5-15 in filament (PETG or PETG CF recommended for strength), and performs identically to the commercial Blue Brick. One reviewer noted: “printed perfectly. I made a few adjustments so the text was flat and I could print face down. no supports needed this way. I also replaced the screw holes with a plug and pin system. I filled the void with cat litter then glued the bottom on.” Another wrote: “Epic print. Came out great & fits my alignment sticks without the need for spacers.”

    MethodCostTimeCustomizationWeight
    Blue Brick (retail)$1290 (just buy it)None3 lbs (fixed)
    DIY Wood/Metal Build$36-508 hoursFull control of anglesCustomizable
    3D Print + Fill$5-15 filament + $3-5 filler15-20 hours print + 1 hour assemblyHole sizes, angles, textCustomizable

    Why DIY Is Actually Superior

    Here’s what the Blue Brick marketing doesn’t want you to know: the fixed angles might not be optimal for your swing. Tour pros swing at approximately 60° with a 6-iron on average, but that’s an average across players with wildly different swing characteristics, body types, and club specifications. A 5’6″ player with a flat swing plane might benefit from different training angles than a 6’4″ player with a more upright swing. Juniors learning the game might need shallower angles to start. Players working on specific swing changes might need exaggerated angles beyond what the Blue Brick offers.

    With DIY or 3D printed versions, you can customize everything. The MakerWorld model explicitly addresses this with adjustable hole sizes, but you could go further—drill additional holes at different angles, create slots for different training drills, add holes for other swing aids, or build multiple versions for different phases of your practice. Want to work on steeper angles for punch shots? Drill a hole at 70°. Want to train a super-shallow driver move? Add a 40° slot. The Blue Brick’s “11 functions” become 20 or 30 functions when you’re not constrained by their fixed design.

    The weight customization matters too. The Blue Brick weighs 3 pounds with its metal base plate, which is fine for most situations but might be too light for hitting off real grass outdoors, or too heavy for carrying around in your bag every day. With a 3D printed version filled with concrete, you can make it 5 pounds for maximum stability. Or fill it halfway for portability. Or make two versions—one heavy for home practice, one light for the range. This kind of customization is impossible with the Blue Brick’s fixed weight.

    The Real Cost Breakdown

    Let’s be honest about what Blue Brick’s costs actually are. The injection molding cost for the base is probably $8-12 per unit at scale. The metal base plate adds another $3-5. Two cheap aluminum alignment sticks cost them maybe $4 wholesale. Packaging, shipping materials, and fulfillment might be $6-8. So their total cost per unit is somewhere around $21-29, and they’re selling it for $129. That’s a 400-550% markup, and while businesses need to make profit, this is excessive even by golf industry standards.

    ComponentBlue Brick Cost (estimated)Your DIY CostYour 3D Print Cost
    Base structure$8-12 (manufacturing)$3-5 (lumber)$5-15 (filament)
    Weight system$3-5 (metal plate)$15-20 (flat bar)$3-5 (concrete fill)
    Alignment sticks (2)$4 (wholesale)$8-12 (retail)$8-12 (retail)
    Screws/inserts$1$2 (M4 inserts/screws)$2 (M4 inserts/screws)
    Total~$21-29$36-50$18-34
    Retail Price$129$36-50$18-34

    To add insult to injury, they originally priced it at $169 before “discounting” to $129, a classic pricing psychology trick that makes you feel like you’re getting a deal when you’re actually just getting ripped off slightly less. The “60-day money back guarantee” is nice, but it’s also legally required in many jurisdictions and doesn’t cost them anything since the return rate on products like this is typically under 5%.

    The Open Source Solution

    The golf community has already solved this problem. The MakerWorld files are free and open source under a standard digital file license. The design has been downloaded thousands of times and refined through community feedback. Users have created variations with flat text that prints without supports, versions with plug-and-pin systems instead of screws, and adaptations for different printer sizes. This is exactly what should happen with overpriced golf equipment—the community reverse-engineers it, improves it, and makes it available to everyone.

    For those without 3D printers, many public libraries now offer 3D printing services for $1-2 per hour of print time. Makerspaces and community workshops are another option. Or you can order prints from online services for $15-25. Even paying someone else to print it for you is still cheaper than buying the Blue Brick, and you get the satisfaction of supporting makers instead of enriching a company that’s charging $90 for labor that a CNC machine performs in 10 minutes.

    The beauty of the 3D printed approach is the rapid iteration. Don’t like how the first one turned out? Print another one with modifications. Want to try different hole angles? Edit the file and print. Alignment stick doesn’t fit quite right? Adjust the hole diameter by 0.2mm and print again. This kind of experimentation would cost you $129 every time with the Blue Brick, but costs you $5 in filament with a 3D printer. Over the course of perfecting your training aid, you could easily save $500+ in iteration costs alone.

    Why This Pricing Is Indefensible

    The Blue Brick markets itself as a tool designed by Golf Digest instructor Clay Ballard, and while his credentials are legitimate, the implication that this justifies the price is laughable. The design work happened once. The angle research happened once. The development of the instructional videos happened once. These are fixed costs that get amortized over thousands of units sold. After the first 100 units, every single Blue Brick sold is nearly pure profit minus the minimal per-unit manufacturing cost.

    Compare this to actual high-tech training aids with real development costs—launch monitors with doppler radar systems, putting mirrors with laser alignment, swing analyzers with accelerometers and gyroscopes. These products have ongoing component costs, firmware development, app maintenance, and genuine engineering complexity. The Blue Brick has drilled holes. It’s not even in the same category, yet they’re pricing it like it contains sophisticated electronics.

    The argument that you’re paying for “precisely engineered angles based on tour data” falls apart when you realize those angles are now public information that anyone can replicate. It’s like trying to charge $100 for a recipe after you’ve already published the recipe in the product description. Once the specifications are known, the value proposition evaporates for anyone with basic tools or access to a 3D printer.

    If you want a Blue Brick-style training aid, you have three vastly superior options: build one from lumber and flat bar for $36-50 in an afternoon, 3D print one for $18-34 using the free MakerWorld files, or pay someone to 3D print one for you for $30-40. All three approaches give you customization options the Blue Brick can’t match, and all three cost a fraction of the $129 retail price. The golf industry’s pricing model desperately needs disruption, and the Blue Brick is exhibit B right after the Stack system.

    What other training aids are ridiculously overpriced? Drop a comment below—let’s build a complete DIY alternative list.

  • DIY Stack Speed Training System: Why Pay $300?

    DIY Stack Speed Training System: Why Pay $300?

    Golf training aids have always walked the fine line between innovation and highway robbery, but the Stack Speed Training System might just take the cake as the most egregiously overpriced piece of equipment in the game. At $300 for what amounts to a weighted stick with some washers, it’s the kind of pricing that makes you wonder if golf equipment manufacturers think we’re all trust fund babies.

    Let’s be clear about what you’re getting for $300: a shaft with removable weights and a proprietary app that requires a serial number to function. Oh, and did I mention there’s also a subscription component? Because apparently selling you a $300 stick wasn’t enough revenue. The real kicker is that the entire system is mechanically simple—it’s threaded rod, washers, and a club shaft. That’s it. No electronics, no smart technology built into the device itself, just weighted training that’s been around in various forms for decades.

    The Stack system comes with five different weight configurations ranging from 165g (lightest, green) to 365g (heaviest, silver), with intermediate weights at 205g (blue), 280g (red), and 325g (black). These weights are fixed, proprietary, and expensive to replace or supplement. But here’s the thing—there’s absolutely nothing special about these specific weight increments, and as we’ll see, there are compelling reasons why you might want completely different weights anyway.

    Weight ConfigurationStack System Weight
    Lightest (Green)165g
    Light (Blue)205g
    Medium (Red)280g
    Heavy (Black)325g
    Heaviest (Silver)365g

    Building Your Own: Two Paths to the Same Destination

    YouTube creator Matthew Ryan from Project Golf recently proved just how absurd Stack’s pricing is by building his own version for under $40. His approach involved grabbing a cheap 5-7 iron from a thrift store, removing the head with a blowtorch, and epoxying a 5/16″ all-thread rod into the shaft. The total materials cost breaks down to about $5-6 for the club, $3 for the threaded rod, $5 for fender washers, $3 for wing nuts, $5 for JB Weld epoxy, and $3 for super glue—roughly $25-30 total. The build process is straightforward: heat and remove the club head (steel shafts only, as composite shaft holes are too small for 5/16″ rod), drill out any remaining epoxy, mark about 1″ depth on the all-thread, coat it with epoxy, and thread it into the shaft. After it dries overnight, you cut the all-thread to 2.5″, create your custom weight stacks by super-gluing fender washers together, attach a wing nut base with a glued 20g weight, stack your custom weights, and secure with a second wing nut.

    ItemCost
    5-7 iron from thrift store$5-6
    5/16″ all-thread rod, 12″~$3
    5/16″ fender washers~$5
    5/16″ wing nuts (pack of 3)~$3
    JB Weld epoxy~$5
    Super glue~$3
    Total$25-30

    The alternative path is to start with the HH-GOLF Swing Speed Trainer available on Amazon for $33. This gives you a quality graphite shaft with a rubber grip already assembled, plus an adjustable screw-on weight system with a female threaded socket that accepts standard fasteners. The stock configuration provides a base shaft weight of 240g, 275g with one 35g weight added, and maxes out at 325g with the included 50g weight. But here’s where it gets interesting—for another $5-12, you can pick up M14 screws and various fender washers from Home Depot and create custom weight stacks that match the Stack system exactly or go well beyond it. Total investment: $38-45 for a complete system with unlimited customization potential.

    ConfigurationWeight
    Base shaft240g
    + 35g weight275g
    + 50g weight (max)325g

    Why Customization Matters More Than You Think

    Here’s the dirty secret of speed training that Stack doesn’t want you to know: one size does not fit all. Stack’s fixed weight increments are designed for an “average” golfer, but that’s a meaningless concept when it comes to individual swing speed development. Juniors and lighter swingers might need lighter starting weights in the 100-140g range with smaller increments between weights, and they might benefit from entirely different training protocols than what Stack prescribes. On the other end of the spectrum, players with heavier driver swing weights might need maximum weights exceeding 400g and larger weight jumps to create adequate overload stimulus. Even among similar-aged adult golfers, different training goals require different approaches—working on tempo versus maximum speed, injury recovery protocols, maintenance phases versus gains phases—all benefit from tailored weight progressions.

    With DIY or modified systems, you control everything. You can mix different washer sizes to hit precise weight targets, add lead tape for fine-tuning, create as many or as few weight configurations as you need, and adjust as your swing speed improves over time. Want to replicate Stack’s exact weights? Easy—just calculate the right washer combinations. Want to create a lighter progression for a junior golfer? Buy smaller washers. Need heavier weights because you’re already swinging 120+ mph? Stack more washers or use heavier hardware. This level of customization is impossible with Stack’s fixed system unless you buy their expensive proprietary add-on weights.

    Target WeightWasher Combination
    20g2x 5/16″ fender washers
    40g4x 5/16″ fender washers
    80g8x 5/16″ fender washers
    100g10x 5/16″ fender washers
    160g (Stack Green equivalent)Mix of fender washers + larger diameter washers

    The price comparison really drives home how absurd Stack’s markup is. They’re charging $300+ for a system with limited customization options that require purchasing proprietary weights. DIY from scratch costs $25-40 with unlimited customization. The modified HH-GOLF approach costs $38-45 with equally unlimited customization. Both DIY approaches deliver the same training stimulus as the Stack while giving you complete control over your weight progression.

    SystemBase CostCustomizationTotal Cost
    Stack System$300Limited (must buy proprietary weights)$300+
    DIY from Scratch$25-30Unlimited$25-40
    Modified HH-GOLF$33Unlimited$38-45

    The Open Source Movement Golf Needs

    Someone in the golf community needs to step up and create 3D printable weight designs with precise gram measurements, open-source training protocols (which are largely public knowledge anyway), free app alternatives that track progress, STL files for whistle attachments, and detailed washer combination charts for exact Stack weight matching. The mechanical design is trivial—there’s no justification for a $300 price tag on what is essentially $15 worth of materials and a free app that artificially requires their hardware via serial numbers.

    If you want to train for speed and add distance to your game, you have two excellent options: DIY from scratch for $25-40 as a complete control afternoon project, or modified HH-GOLF for $38-45 as an easier build that’s still fully customizable. The DIY and modification routes are actually superior because you can match or exceed Stack’s weight range, customize for your body type and goals, adjust as you progress, replace components cheaply if damaged, and build multiple configurations for different training phases. The protocols are widely available online, the app requirement is artificial, and the 900% markup is indefensible. Build your own and get better results for pennies on the dollar.

    Drop a comment below—what other golf training aids are criminally overpriced? Let’s build a list of DIY alternatives,

  • I Paid $199 for a Rypstick. Here’s Why the $33 Alternative Is Just as Good.

    I Paid $199 for a Rypstick. Here’s Why the $33 Alternative Is Just as Good.

    I bought a Rypstick for $199. After using it for six weeks alongside the HH-GOLF Speed Trainer that costs $33, I can tell you with complete certainty that I wasted $166. This isn’t a rant about getting ripped off—it’s an objective breakdown of what you’re actually paying for when you choose premium speed training equipment, and whether that premium delivers any measurable advantage.

    Speed training works. The science is solid, the results are real, and I’ve gained 8 mph of driver swing speed using both systems. But here’s the uncomfortable truth for companies like Rypstick: the training effect is identical regardless of what you spend, because both products are mechanically and functionally the same.

    What You’re Actually Buying

    Both the Rypstick and HH-GOLF are single adjustable speed sticks with graphite shafts, rubber grips, and screw-on weight systems. Neither has electronics, sensors, or any sophisticated technology. The entire product is:

    ComponentRypstickHH-GOLF
    ShaftGraphiteGraphite
    GripRubberRubber
    Weight systemScrew-on discsScrew-on discs
    Weight range270g, 300g, 330g, 360g (420g w/ counterweight)240g, 275g, 325g
    AdjustabilityOne stick, swap weightsOne stick, swap weights
    ElectronicsNoneNone
    App dependencyNo (app is free)No (use any app)

    The core design is identical. You’re swinging a weighted shaft that you can make lighter or heavier by adding or removing screw-on weight discs. The Rypstick offers 5 weight configurations (including the optional counterweight), while the HH-GOLF offers 3. Both use the same training methodology: swing light for speed, swing heavy for strength, alternate to force adaptation.

    The Real Manufacturing Cost

    Let’s break down what these products actually cost to manufacture, because this is where the pricing disconnect becomes obvious. I’ve dabbled in sourcing / product development, and the component costs for speed sticks are straightforward:

    Rypstick Manufacturing Cost (estimated):

    • Graphite shaft blank: $8-12 (bulk pricing for mid-grade graphite)
    • Rubber grip: $1-2 (standard compound grip)
    • Weight head assembly with threading: $4-6 (machined aluminum or steel)
    • Three weight discs (brass or steel): $3-5
    • Optional counterweight: $2-3
    • Packaging: $2-3
    • Assembly labor: $2-3 Total: $22-34 per unit

    HH-GOLF Manufacturing Cost (estimated):

    • Graphite shaft blank: $6-10 (similar quality, possibly lower-tier supplier)
    • Rubber grip: $1-2
    • Weight head assembly: $3-5
    • Two weight discs (304 stainless): $2-3
    • Packaging: $1-2
    • Assembly labor: $1-2 Total: $14-24 per unit
    SystemEst. Manufacturing CostRetail PriceMarkup
    Rypstick$22-34$199585-904%
    HH-GOLF$14-24$33138-236%

    Both companies are making profit, as they should. But Rypstick’s markup is 4-5x higher than what would typically be considered reasonable for a product with no sophisticated technology, no ongoing software costs, and no R&D amortization beyond the initial design (which was completed years ago and has been recouped across thousands of units sold).

    The HH-GOLF markup is standard for a consumer product that needs to cover manufacturing, distribution through Amazon, marketing, and profit margins. The Rypstick markup suggests they’re either spending massive amounts on marketing and Tour pro endorsements, or they’re simply charging what the market will bear because golfers have been conditioned to accept premium pricing.

    The App Offers Features, But Not $166 Worth

    Rypstick’s primary justification for the price premium is their training app, which offers structured workouts, progress tracking, and instructional videos from Dr. Luke Benoit. Let me be specific about what the app actually includes, because this is where Rypstick makes their value argument:

    The Rypstick App is good, but just use it with HH-Golf Stick

    Rypstick App Features:

    Training Protocols (The Core of What You’re Paying For):

    • Level 1 Protocol: 3 swings per weight (270g, 300g, 330g, 360g), alternating dominant and non-dominant hand. Specifically: 3 swings right-handed with 270g, 3 swings left-handed with 270g, rest 60 seconds. Move to 300g, repeat. Continue through all weights. Total: 24 swings per session, roughly 12 minutes including rest. Designed for weeks 1-3 of training.
    • Level 2 Protocol: Same volume (24 swings) but with emphasis on maximum effort and tempo cues. The app specifically tells you “slow on backswing, explosive through the ball” with a metronome counting 1-2-3 on the way back. Adds mental focus on “feeling fast” rather than swinging hard. Designed for weeks 4-8.
    • Level 3 Protocol: Increases volume to 5 swings per weight (40 swings total), with 90-second rest periods. Introduces “step drills” where you start with feet together and step into the swing to engage lower body. Duration increases to 18-20 minutes per session. Designed for weeks 9+.
    • Maintenance Protocol: 2 sessions per week instead of 3, with 3 swings per weight but only using two weights (270g and 360g). Takes 8-10 minutes. For maintaining speed gains during competitive season.
    • Pre-Round Warmup: 2 swings per weight, dominant hand only, ascending through all weights. Takes 3-4 minutes. Designed to activate fast-twitch fibers before teeing off.

    Built-in App Features:

    • Automatic rest timers that beep when it’s time for next set
    • Swing speed tracker where you manually enter your radar measurements
    • Progress graphs showing speed trends over 4-week blocks
    • Form tip videos (20+ videos, 2-5 minutes each) covering posture, grip pressure, sequencing
    • Drill library with variations: kneeling swings, seated swings, “whoosh” drills without the stick

    One-Time Services Included:

    • Free swing video analysis: Submit 3-5 swings on video, receive written feedback within 48 hours analyzing sequencing, tempo, and areas for speed improvement
    • Access to private Facebook group where Dr. Benoit’s team answers training questions

    On paper, this is more comprehensive than I expected. The app is well-designed, the protocols are clearly explained, and the automatic timers are convenient. But here’s the problem: none of this is proprietary information, and the convenience features can be replicated for free.

    All this info is on Youtube

    What You Get Free on YouTube:

    SuperSpeed Golf (Rypstick’s main competitor) has published their entire Level 1-3 protocol structure on YouTube. Their exact protocol, which is publicly available and used by thousands of golfers:

    • SuperSpeed Level 1: Light stick: 3 swings dominant hand + 3 swings non-dominant hand. Medium stick: 3 swings dominant + 3 swings non-dominant. Heavy stick: 3 swings dominant + 3 swings non-dominant. Rest 45-60 seconds between weight changes. Total: 18 swings, 10-12 minutes per session, 3x per week.

    This is functionally identical to Rypstick’s Level 1 protocol—the only difference is Rypstick adds one more weight (360g) for 6 additional swings. The core methodology is exactly the same.

    • SuperSpeed Level 2: Same structure with emphasis on maximum effort swings and tempo work. They specifically teach “slow and smooth on backswing, explosive through impact”—the exact same tempo cue Rypstick uses.
    • SuperSpeed Level 3: Increases to 5 swings per weight with longer rest (90 seconds) and introduces step drills where you start with feet together and step into the swing. Again, identical to Rypstick’s Level 3 protocol.

    The tempo cues, form tips, and drill variations that Rypstick charges $199 to access via their app are all available in free YouTube videos. Search “SuperSpeed Golf protocol” and you’ll find complete workout videos walking through exactly what to do. Me and My Golf, Athletic Motion Golf, and dozens of other instructors have also published free videos explaining overspeed training protocols using the exact same methodology.

    The step drills? SuperSpeed has multiple free videos explaining them—start with feet together, step toward target with lead foot as you start downswing, generates lower body power. The kneeling drills? Multiple free tutorials available showing how to swing from your knees to isolate upper body speed and eliminate lower body compensation. The form tips about maintaining posture and sequencing? That’s basic swing instruction available in thousands of free videos from instructors like Clay Ballard, George Gankas, and Monte Scheinblum.

    App Feature Alternatives:

    Rypstick App FeatureFree AlternativeCost
    Rest interval timersInterval Timer app (iOS/Android)Free
    Swing speed trackingNotes app or Google SheetsFree
    Progress graphsGoogle Sheets with auto-chartingFree
    Form tip videosYouTube (SuperSpeed, AMG, etc.)Free
    Drill variationsYouTube search: “speed training drills golf”Free
    Swing analysisPost in /r/golf or GolfWRX forumsFree

    The one genuinely valuable service is the free professional swing analysis from Dr. Benoit’s team. That probably costs Rypstick $20-30 in instructor time per customer who uses it (many don’t). If you got a single online lesson from a teaching pro, you’d pay $50-100 and get the same or better feedback. Building this into every unit’s price means you’re subsidizing everyone else’s swing reviews whether you use the service or not.

    The Bottom Line on the App:

    The Rypstick app is well-executed and convenient. If it added $20-30 to the product cost, I’d say it’s worth it for the convenience of having everything in one place with automatic timers and clean UI. But it doesn’t add $166 of value when the same information and better alternatives are freely available. You’re paying for packaging and branding, not for access to secret training knowledge.

    Build Quality Assessment

    After six weeks of using the Rypstick, I can report that it’s a well-built product. The graphite shaft feels solid with no flex issues, the rubber grip is standard compound identical to what’s on my regular clubs, and the weight discs screw on and off smoothly with good threading. The white finish has some minor scuffing from contact with my garage floor, but nothing that affects function. The optional 60g counterweight is a nice feature if you want to train with very heavy resistance (420g total).

    Looking at HH-GOLF specifications and the 500+ verified purchase reviews on Amazon, the build quality appears comparable. Users consistently report solid construction, with the main complaints being that weights can loosen if not properly tightened (same issue with any screw-on weight system, including Rypstick) and that the grip may need replacement after heavy use (standard for any rubber grip that costs $5-8 to replace).

    The graphite shafts are the same material. The grips are the same compound. The weight attachment mechanism is the same screw-on design. One reviewer who owned both a premium speed stick and the HH-GOLF noted they were “basically the same at 1/4th the price.” Another user reported that after one year of use, despite some cosmetic wear, the HH-GOLF was “still working great, and I truly hit driver about 20-30 yards longer than when I started.”

    If the Rypstick cost $50-60 and offered marginally better threading or finish, I could see justifying a small premium. At $199 vs $33, any build quality differences are too minor to matter for training effectiveness.

    The Bottom Line

    The Rypstick is a good product. It works exactly as advertised, it’s well-built, and it will help you gain swing speed if you use it consistently. I gained 8 mph over six weeks using it, which is in line with what they promise. But after analyzing what you’re actually paying for and comparing it to the HH-GOLF specifications and user reviews, I can’t justify the $166 premium.

    The two products are functionally identical where it matters—the training stimulus they provide. Both are adjustable graphite speed sticks with screw-on weights. Both use the same training methodology because there’s only one way to do overspeed training. The protocols in Rypstick’s app are the same protocols available free on YouTube. The build quality differences are minimal and don’t affect performance.

    If you value the professional app, the brand name, and having everything packaged together, and $166 is negligible to your budget, buy the Rypstick. You’ll be happy with it because it works. But if you’re looking at this as a value proposition—which training aid gives you the best results per dollar spent—the HH-GOLF delivers the same training effect for $33.

    I paid $199 for the Rypstick. If I could go back, I’d have just bought the HH-GOLF, saved $166, and gotten the same swing speed gains using free YouTube protocols. The lesson here isn’t that Rypstick is a bad product—it’s that premium pricing in golf training aids rarely delivers proportional value when the underlying technology is this simple.

    Have you tried different speed training systems? What’s your experience with premium vs budget equipment? Drop a comment—I’m genuinely curious if anyone found enough difference to justify the premium?

  • HH-Golf Swing Speed Trainer Review

    HH-Golf Swing Speed Trainer Review

    I purchased the HH-GOLF Swing Speed Trainer as part of a dedicated off-season program to improve clubhead speed without sacrificing control. Coming from a background of structured simulator practice, I wanted a single, adjustable-weight trainer that could replicate the benefits of more expensive systems like SuperSpeed or Rypstick, but at a fraction of the cost. The trainer’s three weight settings, compact form, and standard golf grip seemed perfect for both indoor simulator work and pre-round warm-ups. The graphite shaft and stainless-steel weights promised durability, while the swing weights suggested realistic feel.

    Trainer has two well-machined steel weights that screw on to shaft

    Before incorporating it into my speed protocols, I tested the build quality and ergonomics. The rubber grip is functional, though slightly firmer than my gamer clubs. Weight changes are straightforward, but the threaded inserts require careful tightening to prevent mid-session loosening—a known issue from online reviews. Overall, my first impression was that this tool could become a legitimate driver of swing speed gains if paired with a disciplined, measurable routine.


    Usage

    I integrated the HH-GOLF trainer into my weekly practice in the simulator bay, using it alongside my driver and 7-iron for comparative speed data. My typical session began with the lightest weight for overspeed training, then moved to the medium weight for transition rhythm, and finally the heaviest weight to build strength in the downswing. Using the TrackMan Speed Training system, which can be accessed by going to Training > Shot Analysis, I could immediately see speed variance between the weighted stick and my gamer driver. This pairing allowed me to track incremental progress with precision.

    A typical HH-GOLF session can be structured as follows:

    DrillDetailed Description & Purpose
    Non-Dominant Hand SwingsTo perform this drill, grip the HH-GOLF trainer with your non-dominant hand only, placing the other hand lightly on the shaft for stability if necessary. Take a normal address position, then make full, fluid swings focusing on maintaining balance and generating as much speed as possible through impact. The key is to keep your body rotating through the shot rather than letting the arm dominate the motion. You will likely feel less control at first, which is expected; the objective is to challenge your coordination and sequencing. Over 10–15 swings, your body begins to adapt by engaging stabilizing muscles and improving your range of motion on the weaker side. This drill is extremely useful because it addresses asymmetry in your swing, strengthens underused muscles, and creates a more balanced kinematic sequence, all of which translate to improved consistency and injury prevention in your dominant-side swing.
    Freezer at Top of SwingBegin by addressing the ball area and taking the club back into your full backswing position. Once you reach the top, pause and hold this position for two full seconds, ensuring your weight is loaded into your trail side and your wrists maintain their hinge. After the pause, initiate the downswing with a powerful rotation of the hips while maintaining your spine angle. Focus on feeling the sequence: hips, torso, arms, then club. Repeat this for 8–10 swings. The freezer drill is valuable because it trains patience and control at the transition, reduces casting, and helps you retain stored energy for a more explosive downswing. This builds awareness of correct sequencing and reinforces lag, a key factor in maximizing clubhead speed without sacrificing accuracy.
    Lead Heel Lift SwingsSet up normally, but as you start your backswing, allow your lead heel to lift off the ground slightly. At the top of your swing, drive your lead heel back into the ground as you begin the downswing, feeling the pressure shift forward. This action should trigger a more aggressive ground-force reaction, leading to higher speed through impact. Perform 6–8 repetitions, focusing on rhythm and timing the heel plant with the start of your hip rotation. This drill is important because it encourages a more athletic weight shift, promotes the use of ground forces to generate power, and helps players feel a dynamic lower body in the swing. It is especially beneficial for golfers who tend to “hang back” or fail to transfer weight effectively into the lead side.

    This trainer pairs exceptionally well with the Rypstick App, which provides detailed drill instructions and specifies whether to perform reps on your dominant or non-dominant side. The app also advises on which weights to use for each phase and builds in micro-breaks to keep fatigue from affecting swing quality. By following the app’s structure with the HH-GOLF stick, I was able to blend scientific progressions with cost-effective equipment.

    Trainer length compared to my driver/7-wood

    For indoor work, the trainer’s 45-inch length fit comfortably into the hitting area without risk of ceiling strikes. I used the heavier setting for pre-round warmups before sim play, which helped me get past the “first three holes” sluggishness I usually have in cold starts. Switching between the HH-GOLF and my actual driver highlighted tempo improvements—less rushed in the transition and more balanced at finish.


    Efficacy

    Within my first two sessions, I recorded a measurable increase in driver swing speed—from 81.0 mph to 85.0 mph, confirmed on TrackMan. This gain translated into better carry potential, especially on my mid-to-long par 4 tee shots in simulated play. By the third week, I could hit my 3-wood with more authority, carrying hazards I’d previously been short of in my home course simulation (notably the cross-bunker on Hole 7).

    Trackman swing speed trainer provides feedback

    The overspeed principle worked as intended—lighter swings trained my body to move faster than normal, and heavier swings helped me maintain stability and sequence at higher velocities. The HH-GOLF system doesn’t come with a proprietary training protocol, so I followed a modified SuperSpeed Level 1 progression, using the heavier stick to replicate late-round fatigue conditions. This combination helped me sustain my swing speed even toward the back nine in on-course play.

    On the course, the benefits showed most clearly on holes that demand both distance and accuracy under fatigue. For example, on a simulated version of Hole 14 at my home course—a long par 5 into wind—I was able to carry the crest of the fairway hill, setting up a realistic chance to reach in two. This wasn’t possible before adding speed training. On short par 4s like Hole 4, where control is key, the improved sequencing meant I could step down to a 3-wood without losing much distance, keeping me in play more often.


    Final Word

    The HH-GOLF Swing Speed Trainer is an excellent entry point into serious swing speed training for players who want measurable, transferable results without the premium price tag of name-brand competitors. While Rypstick and SuperSpeed retail for around $199–$299, the HH-GOLF comes in at roughly $30–$35, making it less than one-sixth the price. For budget-conscious golfers or those unsure if speed training will fit their long-term routine, it’s a compelling way to get started.

    If your goal is to increase swing speed by 3–7 mph over several weeks, and you’re willing to commit to a consistent routine, this trainer can absolutely deliver. Just be sure to treat it like a real club—tighten the weights, swing in a safe space, and use it in conjunction with your normal clubs to ensure the gains transfer to actual shots. For the cost, it’s one of the most effective training aids I’ve added to my bag.

  • Lihengkong Golf Impact Sticker Review

    Lihengkong Golf Impact Sticker Review

    There are multiple ways to assess where the ball is striking the clubface—foot spray, dry-erase markers, high-speed cameras—but in an indoor simulator setting, those options can be messy or impractical. That’s where the Lihengkong Golf Impact Stickers shine. I love using these at Golf Lab CT, where space is clean, tech-driven, and designed for data. I originally chose these stickers because they were the cheapest per sticker I could find on Amazon, but they’ve turned out to be one of the best golf purchases I’ve made.

    60 stickers for $7ish

    The pack includes sticker sets for drivers, irons, and putters. Although the putter sticker seems a little unnecessary, I personally like to place them at the bottom of my iron to capture topped shots. Application takes seconds—just peel and stick. The stickers stay secure during the swing and don’t shift even after multiple shots. Removing them doesn’t leave any residue on the clubface. Each sticker lasts for approximately 10-15 quality shots before losing clarity. The pack includes enough stickers for dozens of practice sessions. They’re clearly labeled and easy to apply in alignment with grooves.

    Efficacy

    The Lihengkong stickers reliably capture impact locations, even after multiple swings. Visual feedback is immediate and intuitively easy to interpret. Sweet spot hits result in a clean purple center mark, while toe, heel, thin, or fat strikes leave distinct patterns. The sticker doesn’t just confirm the location of impact—it also reinforces how a mis-hit sounds and feels. This teaches your hands and ears to recognize poor contact even without visual proof, creating a sharper internal feedback loop.

    When compared with data from TrackMan, the accuracy of the stickers becomes especially apparent. In the image provided, the TrackMan software reported a clear toe strike—exactly mirrored by the sticker’s mark. This synergy between tech and tactile aid helps build muscle memory. Over time, golfers can begin to recognize toe or heel contact instinctively, even when not using the sticker. That kind of proprioceptive training is invaluable for developing consistent, repeatable ball striking.

    Toe hit mirrored on trackman (see yellow curve intersecting club)

    The printed zones also help categorize strike tendencies—heel, toe, high, low, or center—and quickly reveal patterns that may point to setup flaws, swing path issues, or face control errors. The stickers work extremely well in tandem with a launch monitor, but they’re equally valuable in solo practice, offering a clear, low-tech snapshot of each swing’s quality. These strike tendencies can guide useful corrections. Toe strikes may signal you’re standing too far or swinging excessively from the inside. Heel strikes could indicate overcrowding or an over-the-top move. Hitting above the sweet spot may suggest early extension or wrist flipping, while low strikes can often be traced to poor posture or too much shaft lean. These stickers don’t just identify the problem—they nudge you toward the fix.

    Strike Location Feedback Table

    Strike LocationMost Common Cause & Drill
    ToeOften caused by standing too far from the ball. Use a gate drill with two tees just wider than the clubhead. Place one tee outside the toe and one inside the heel. Practice hitting the ball without striking the outer tee to retrain path and distance from the ball.
    HeelTypically from standing too close or an over-the-top path. Same gate drill applies: focus on avoiding the inner tee to eliminate heel contact. Maintain better posture and inside path through the zone.
    Above Sweet SpotOften the result of early extension or standing up through the swing. Place a strip of painter’s tape 1–2 inches in front of the ball and try to brush the tape after contact. This promotes a shallower angle of attack and consistent low point.
    Below Sweet SpotUsually caused by poor low-point control or too steep of an angle. Place a coin or plastic tee 1–2 inches in front of the ball and focus on brushing the ground past the ball to improve bottoming out post-impact. Encourages proper shaft lean and forward contact.

    Final Word

    Lihengkong’s Golf Impact Stickers are one of the most effective and budget-friendly additions to any serious golfer’s training arsenal. They deliver immediate, visual feedback, require no tech setup, and integrate seamlessly into any practice setting—whether you’re grinding on a TrackMan or hitting into a backyard net. Their power lies in converting vague swing sensations into crystal-clear impact data. For under $10, they offer one of the most cost-effective ways to gain insight into your ball striking. I originally chose them based on value—and they’ve far exceeded expectations. Unlike high-speed cameras or foot spray, these stickers are mess-free, portable, and take seconds to use.

    While the performance is outstanding, a few small improvements could elevate the product even further. The putter sticker feels unnecessary and could be replaced by extra iron or driver stickers, which get far more use. The iron sticker could be slightly larger to offer more surface coverage, especially on mid-irons. And a thinner material might allow for a bit more gear effect visibility on wedges—useful when working on compression and strike quality. These are minor critiques of what is otherwise a smart, versatile, and thoughtfully designed tool.

    For any golfer committed to measurable improvement, I can’t recommend these enough. They combine affordability, clarity, and consistency in a way few other training aids do. I keep a few sheets in my bag at all times and pair them with TrackMan sessions for double confirmation. Whether you’re just starting out or dialing in your peak-season form, these stickers make every swing more productive.

  • WhyGolf Pressure Plate Review

    WhyGolf Pressure Plate Review

    The WhyGolf Pressure Plate is a simple, sturdy training aid that gives golfers immediate feedback on weight shift during the swing. Shaped like a see-saw, it rocks forward when pressure is applied to the lead foot — helping golfers learn to post properly into impact. It’s low-tech, portable, and easy to use, especially when paired with launch monitors like TrackMan to evaluate its impact on metrics like launch angle, spin loft, and carry distance. However, at $99, it’s a premium price for a passive tool — read on to see whether it’s worth it for your game.

    Efficacy

    The Pressure Plate is highly effective at training ground force mechanics through feel. By physically tipping when the user shifts weight forward, it reinforces a proper transition and finish position. This can help reduce early extension, scooping, or reverse pivots. When used regularly, it builds better low-point control and compression.

    It excels in training sequencing and awareness but doesn’t address swing plane, face control, or path. Think of it as a targeted feel trainer for pressure — not a comprehensive solution.

    Here’s the condensed sequence to follow during a swing:

    1. Address Setup: Place the Pressure Plate under your left foot (for right-handed golfers), with the arrows pointing toward the target. Stand square, balanced, and athletic.
    2. Backswing: Keep your weight centered and avoid drifting over your trail foot. Maintain coil and stability.
    3. Transition: Shift your weight into your lead foot as the downswing begins. The Pressure Plate should audibly and physically tip forward at this exact moment.
    4. Impact: Your weight should be mostly on your lead foot (around 80%). You should feel braced and posted through impact with hands leading the clubface.
    5. Finish: Maintain balance with all weight on the front side. The Pressure Plate should stay fully tipped forward.

    This sequence helps reinforce the feel of proper ground engagement — critical for low-point control, compression, and repeatable ball-first contact.

    Ease of Use

    Setup is instant: place it under your lead foot, and you’re ready to go. No batteries, no calibration, and no learning curve. It’s light enough to carry in a golf bag, works indoors and out, and can be used with or without hitting balls.

    Its stability is a major plus. Unlike wobbly balance discs or DIY contraptions, the WhyGolf model is solid underfoot. Players can confidently make full swings without slipping, which makes it ideal for sustained use over time.

    Measurability

    The Pressure Plate doesn’t collect data itself, but it integrates well into a measurable routine when paired with TrackMan Shot Analysis mode. Users can monitor key metrics like attack angle, spin loft, ball speed, launch angle, spin rate, height, and carry distance. Here’s what happens if one doesn’t weight shift properly (as trained by the pressure plate).

    MetricEffect of Poor Weight Shift
    Attack AngleWithout proper pressure into the lead foot, the attack angle becomes too shallow. The club may skim the ground or bottom out behind the ball, increasing the risk of fat and thin shots. Ground-first contact becomes inconsistent, especially with irons.
    Spin LoftPoor weight shift limits forward shaft lean and maintains excessive dynamic loft, which widens spin loft. This results in weak, high-spinning shots with poor compression and inefficient energy transfer to the ball.
    Ball SpeedInadequate lower-body movement reduces the ability to transfer energy from the ground up. This typically leads to lower ball speed, even if clubhead speed remains the same, because strikes tend to be off-center and poorly compressed.
    Launch AnglePlayers who hang back often present more loft at impact, increasing launch angle. This causes high, floaty ball flights that climb too quickly and stall in the air, reducing overall distance and control.
    Spin RateA lack of pressure shift often leads to less precise contact, which can either decrease spin (from low compression) or create excess spin from glancing, high-loft strikes. In either case, spin becomes inconsistent and hard to control.
    HeightPoor weight transfer leads to higher dynamic loft and spin, resulting in ballooning shots. Peak height increases beyond ideal levels, especially with mid-irons, making shots vulnerable to wind and reducing distance.
    Carry DistanceFailure to shift pressure forward reduces both compression and ball speed. As a result, carry distance suffers significantly, even with solid tempo. The ball launches high but weak, often falling well short of target yardages.

    Cost

    At $99, the WhyGolf Pressure Plate is priced near the top of the no-tech golf training aid market. While its durable construction and golf-specific feedback are strong points, the price is difficult to justify for most recreational players — especially when it offers no built-in data, has no adjustability, and relies entirely on feel.

    Comparable results can often be achieved using lower-cost tools. A $19 AmazonBasics Wobble Balance Board provides instability that builds lower-body control and awareness. Even more specific to the Pressure Plate’s intent are rocker boards. These also mimic forward-tipping action and can also simulate the sensation of weight transfer into the front side during transition, helping train the same lead-side posting pattern promoted by the WhyGolf model. What separates the Pressure Plate is its refined feel, consistent resistance, and golf-specific footprint. But those refinements come at a high markup. For many players, especially those not practicing with a launch monitor or working under a coach, these extras may not be worth the added cost.

    Final Take

    Despite offering clear feedback and measurable improvement when combined with structured launch monitor use, the WhyGolf Pressure Plate is ultimately difficult to recommend for most golfers. At $99, it lacks adjustability, built-in data tracking, and broader swing diagnostic utility. For casual players or those on a budget, lower-cost options like balance discs or wobble boards provide much of the same benefit at a fraction of the cost. Unless you’re a coach or dedicated data-driven player, this tool may not deliver enough return on investment.